


Between the margins August 2026
August 2026
Did the Fed get it wrong in July?
August 2026
Did the Fed get it wrong in July?

Executive summary
- The bond market didn’t appear too happy in the wake of the Fed’s July press conference.
- It’s not the immediate market reaction that matters, but rather the Fed’s interpretation of long-term trends impacting the economy.
- That’s not as clear as you might think.
- The yield curve gives mixed signals; it’s moved higher, but not because of higher inflation expectations.
- Rather, real yields get the credit, and parsing the drivers there isn’t straightforward.

At the July Fed meeting, Kevin Warsh and company delivered the outcome most anticipated by futures pricing: They held rates steady. But the bond market disapproved. Take a look at the change in the U.S. Treasury yield curve before and after the Fed meeting in our “Chart of the month” below.
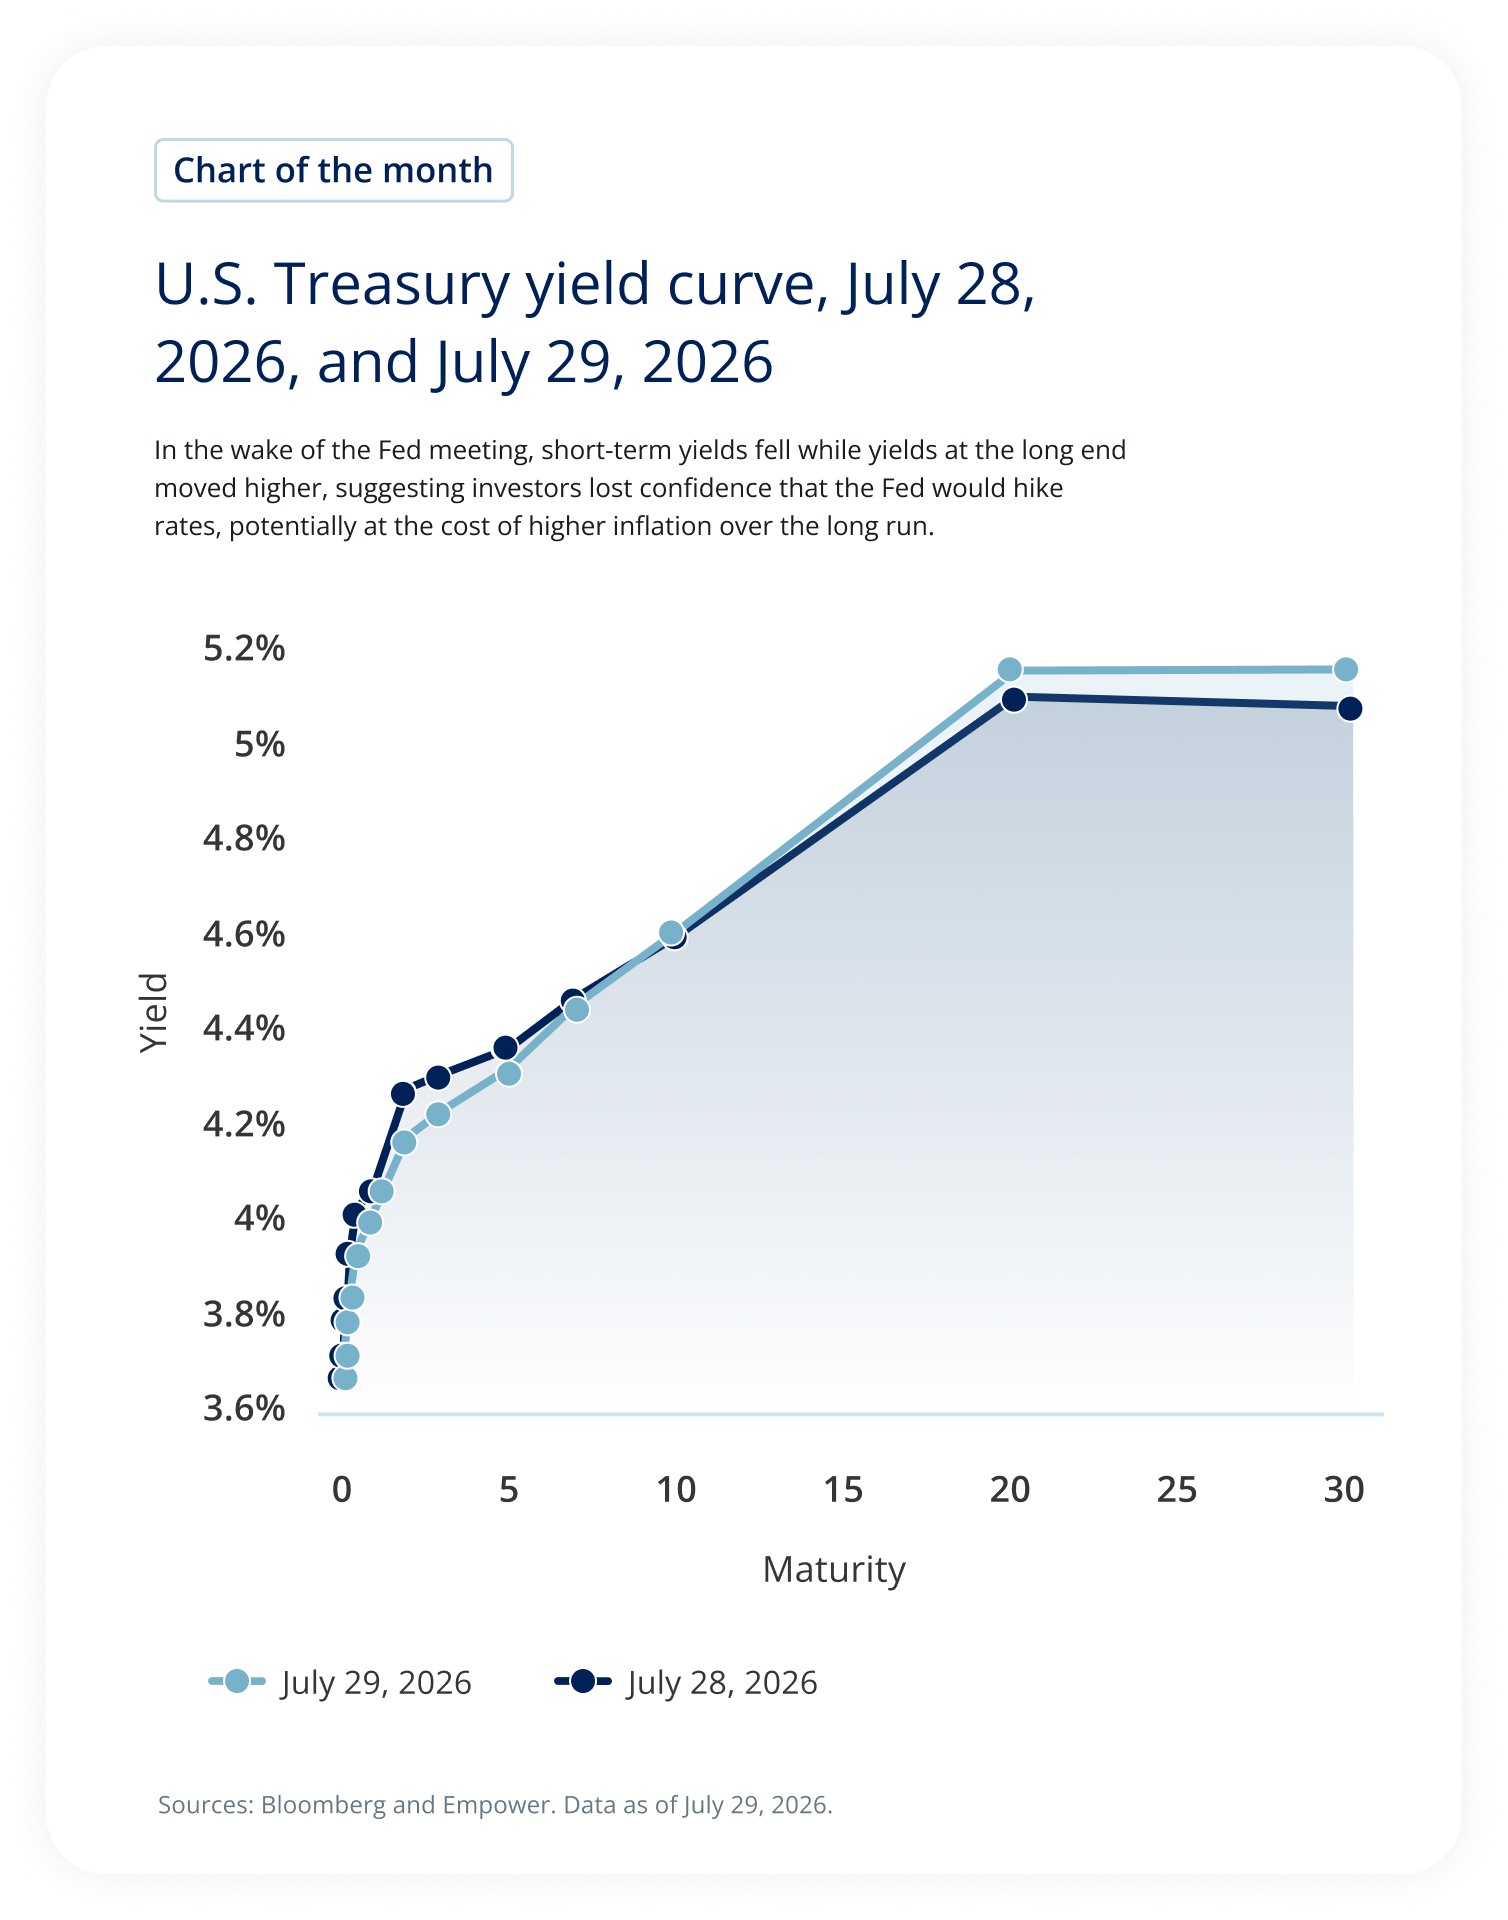
The chart compares the U.S. Treasury yield curve on July 28 and July 29, 2026, across maturities ranging from very short-term Treasury securities to 30-year bonds. On July 29, short-term Treasury yields were lower than the previous day, while yields at longer maturities were slightly higher.
Both curves rise with maturity, from roughly the upper-3% range at the shortest maturities to above 5% for 20- and 30-year Treasuries. The July 29 curve sits below the July 28 curve at shorter maturities, converges around the 10-year maturity, and moves above it at the 20- and 30-year maturities.
Key takeaway: Following the Fed meeting, the yield curve steepened as short-term yields declined while long-term yields increased slightly. The graphic interprets this as investors becoming less confident that the Federal Reserve would raise rates while potentially anticipating greater long-term inflation risk.
The bond market’s early consternation may not reflect the decision itself. It could, instead, reflect questions that arose from a hold with three dissents — all in favor of a rate hike — and a statement that emphasized inflation over labor concerns.
But let’s not discount Warsh’s press conference itself. We’re all (including, it seems, Warsh himself) adjusting to the Fed’s new effort to abstain from forward guidance. Not only did Warsh avoid saying much about future decisions, he also avoided saying much about the decision the Fed had just made to keep the Fed funds rate steady, leaving most observers confused about the Fed’s interpretation of prevailing economic conditions.
Of course, the failure or success of Fed policy is not determined by the market’s immediate reaction. What ultimately matters is whether the Fed correctly interprets the forces shaping the economy. Consider the Fed’s three rate cuts in the fall of 2025. In hindsight, the market’s initial reaction told us far less than where we stand today, with a (generally) stable labor market and persistent inflation, driven not only by the war but also, as former Fed Chair Jerome Powell observed as early as the March 2026 Fed meeting, by lingering tariff inflation in goods; an AI inflationary effect; and little progress in non-housing services pricing (also known as supercore inflation).
The cuts then — and the concerns now — reinforce the idea that it is far harder than it looks to correctly interpret and react to the long-term trends in the economy.
In the prevailing environment, take the yield curve. At face value, it makes perfect sense that it would move higher over the course of 2026 in response to sticky inflation and the on/off war in Iran, which elevated gas prices and runs the risk of secondary effects if the supply shock continues.
However, it hasn’t actually been inflation expectations that have shifted the yield curve higher this year. In fact, over the course of the year, breakevens — or the difference between real (inflation-adjusted) and nominal rates — remain contained, even over shorter maturities, suggesting that investor perception of future inflation remains anchored.
Instead, the nominal yield curve has moved higher on the back of real rates. Real rates are driven by several factors, including expectations for economic growth; the future path of policy rates (and the uncertainty surrounding it); and technical factors, such as the supply of and demand for U.S. Treasuries.
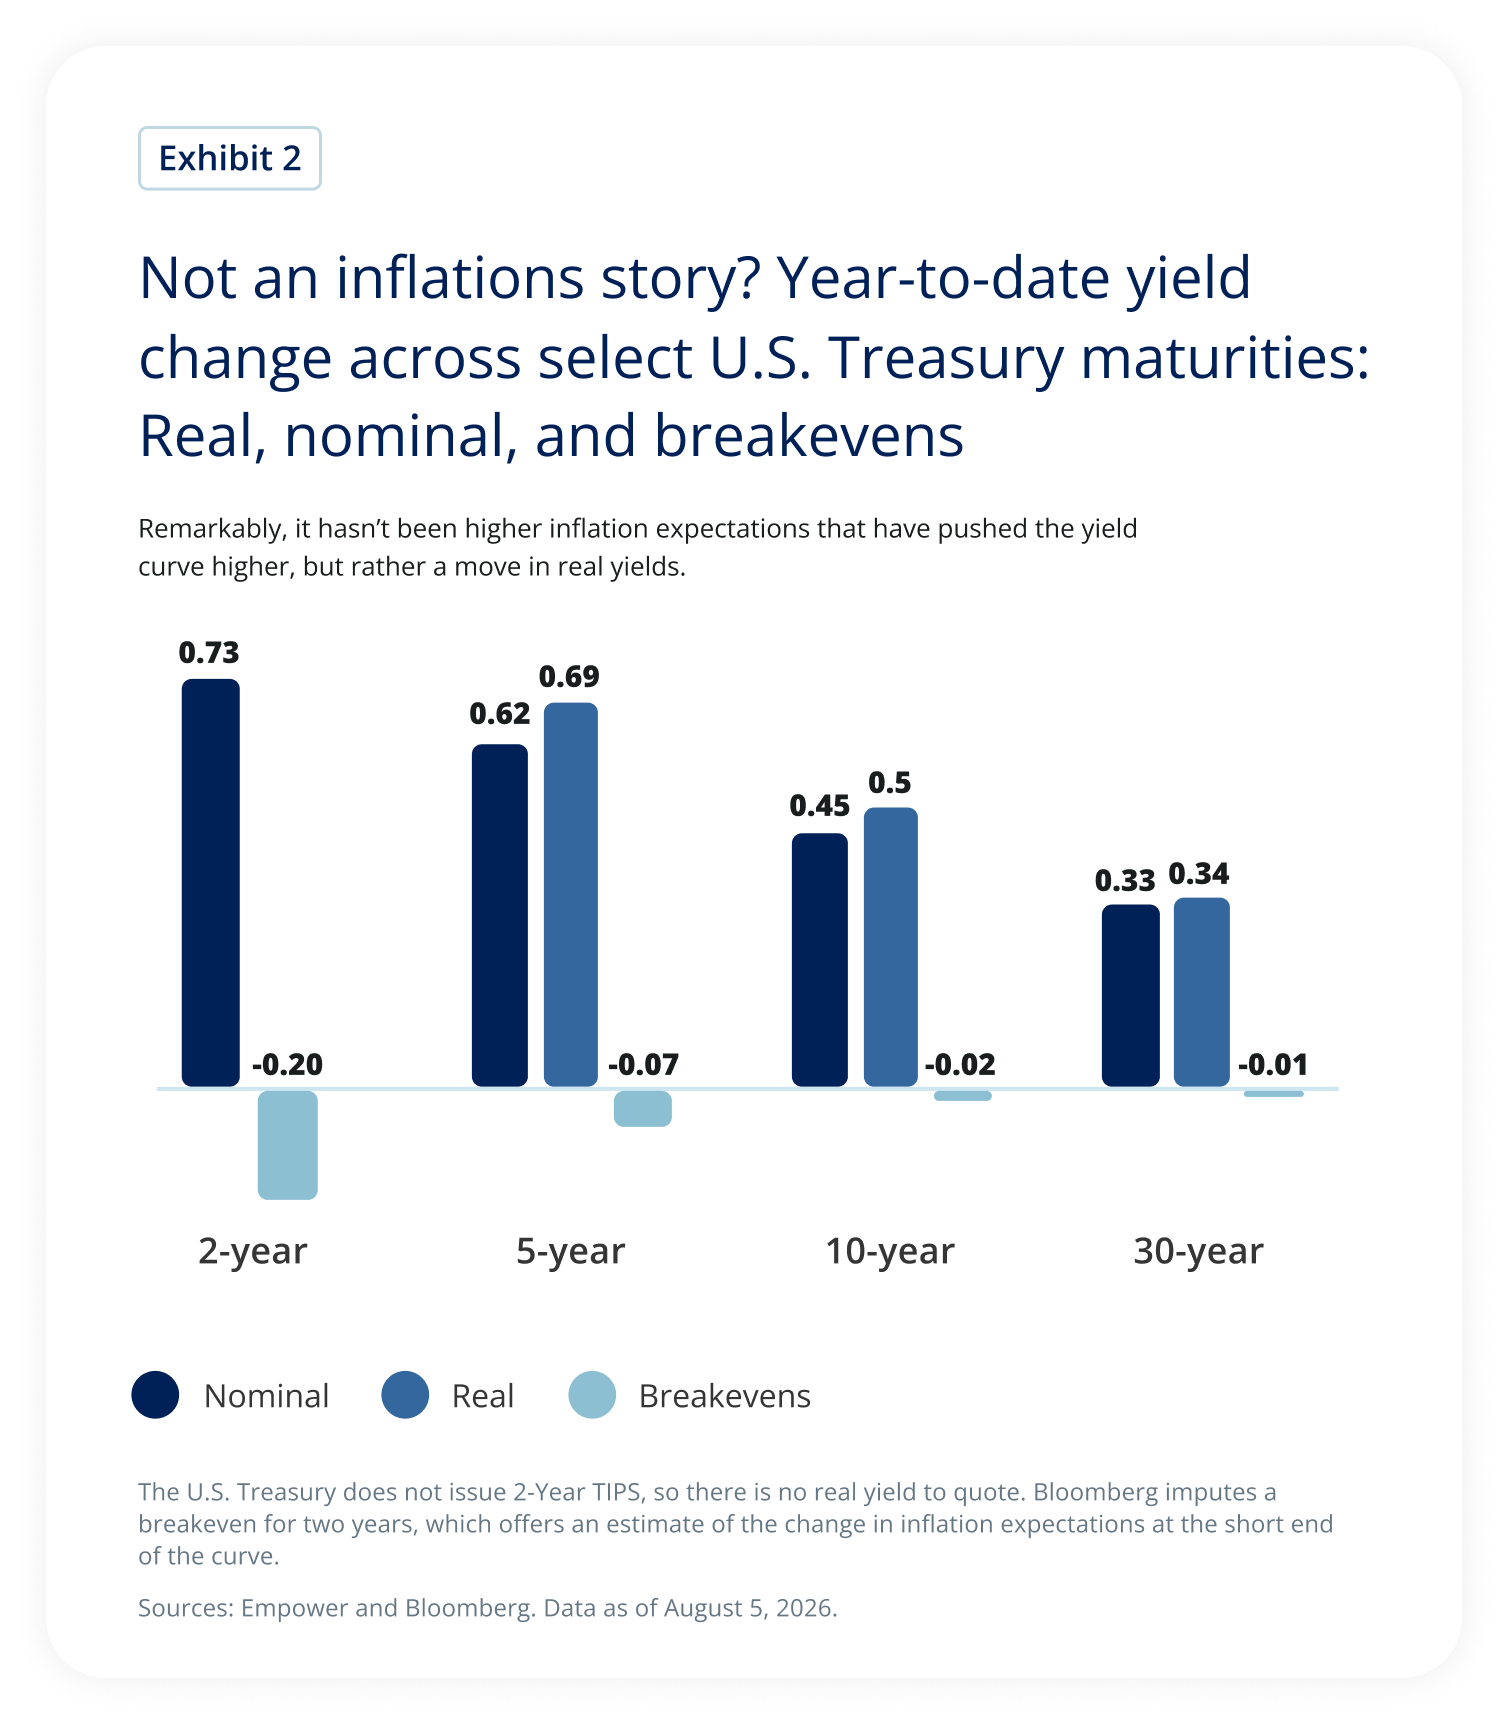
The chart compares year-to-date changes in nominal yields, real yields, and inflation breakevens for selected U.S. Treasury maturities as of August 5, 2026.
Nominal yields increased across all four maturities shown: 0.73 percentage points for the 2-year, 0.62 for the 5-year, 0.45 for the 10-year, and 0.33 for the 30-year Treasury.
For maturities where real yields are shown, they increased by 0.69 percentage points for the 5-year, 0.50 for the 10-year, and 0.34 for the 30-year Treasury. A 2-year real yield is not shown because the U.S. Treasury does not issue 2-year TIPS.
Inflation breakevens, by contrast, declined across all four maturities: -0.20 percentage points for the 2-year, -0.07 for the 5-year, -0.02 for the 10-year, and -0.01 for the 30-year Treasury. The 2-year breakeven is an estimate calculated by Bloomberg.
Key takeaway: The increase in Treasury yields has primarily reflected higher real yields rather than increasing inflation expectations. Breakeven inflation expectations have actually moved slightly lower year to date.
Let’s take each of those potential drivers in turn. Economic growth has certainly outpaced the expectations many had of an inevitable recession. But it’s hard to reconcile the recent 1.5% real gross domestic product (GDP) print for the second quarter with real rates moving markedly higher due to an accelerating economic environment. GDP forecasts remain similarly muted, making it less likely that the market anticipates a sudden acceleration from here.
However, even without higher GDP estimates or discernible signs of AI-fueled productivity gains, we see some early signs of an AI effect, most notably with hyperscaler debt issuance.
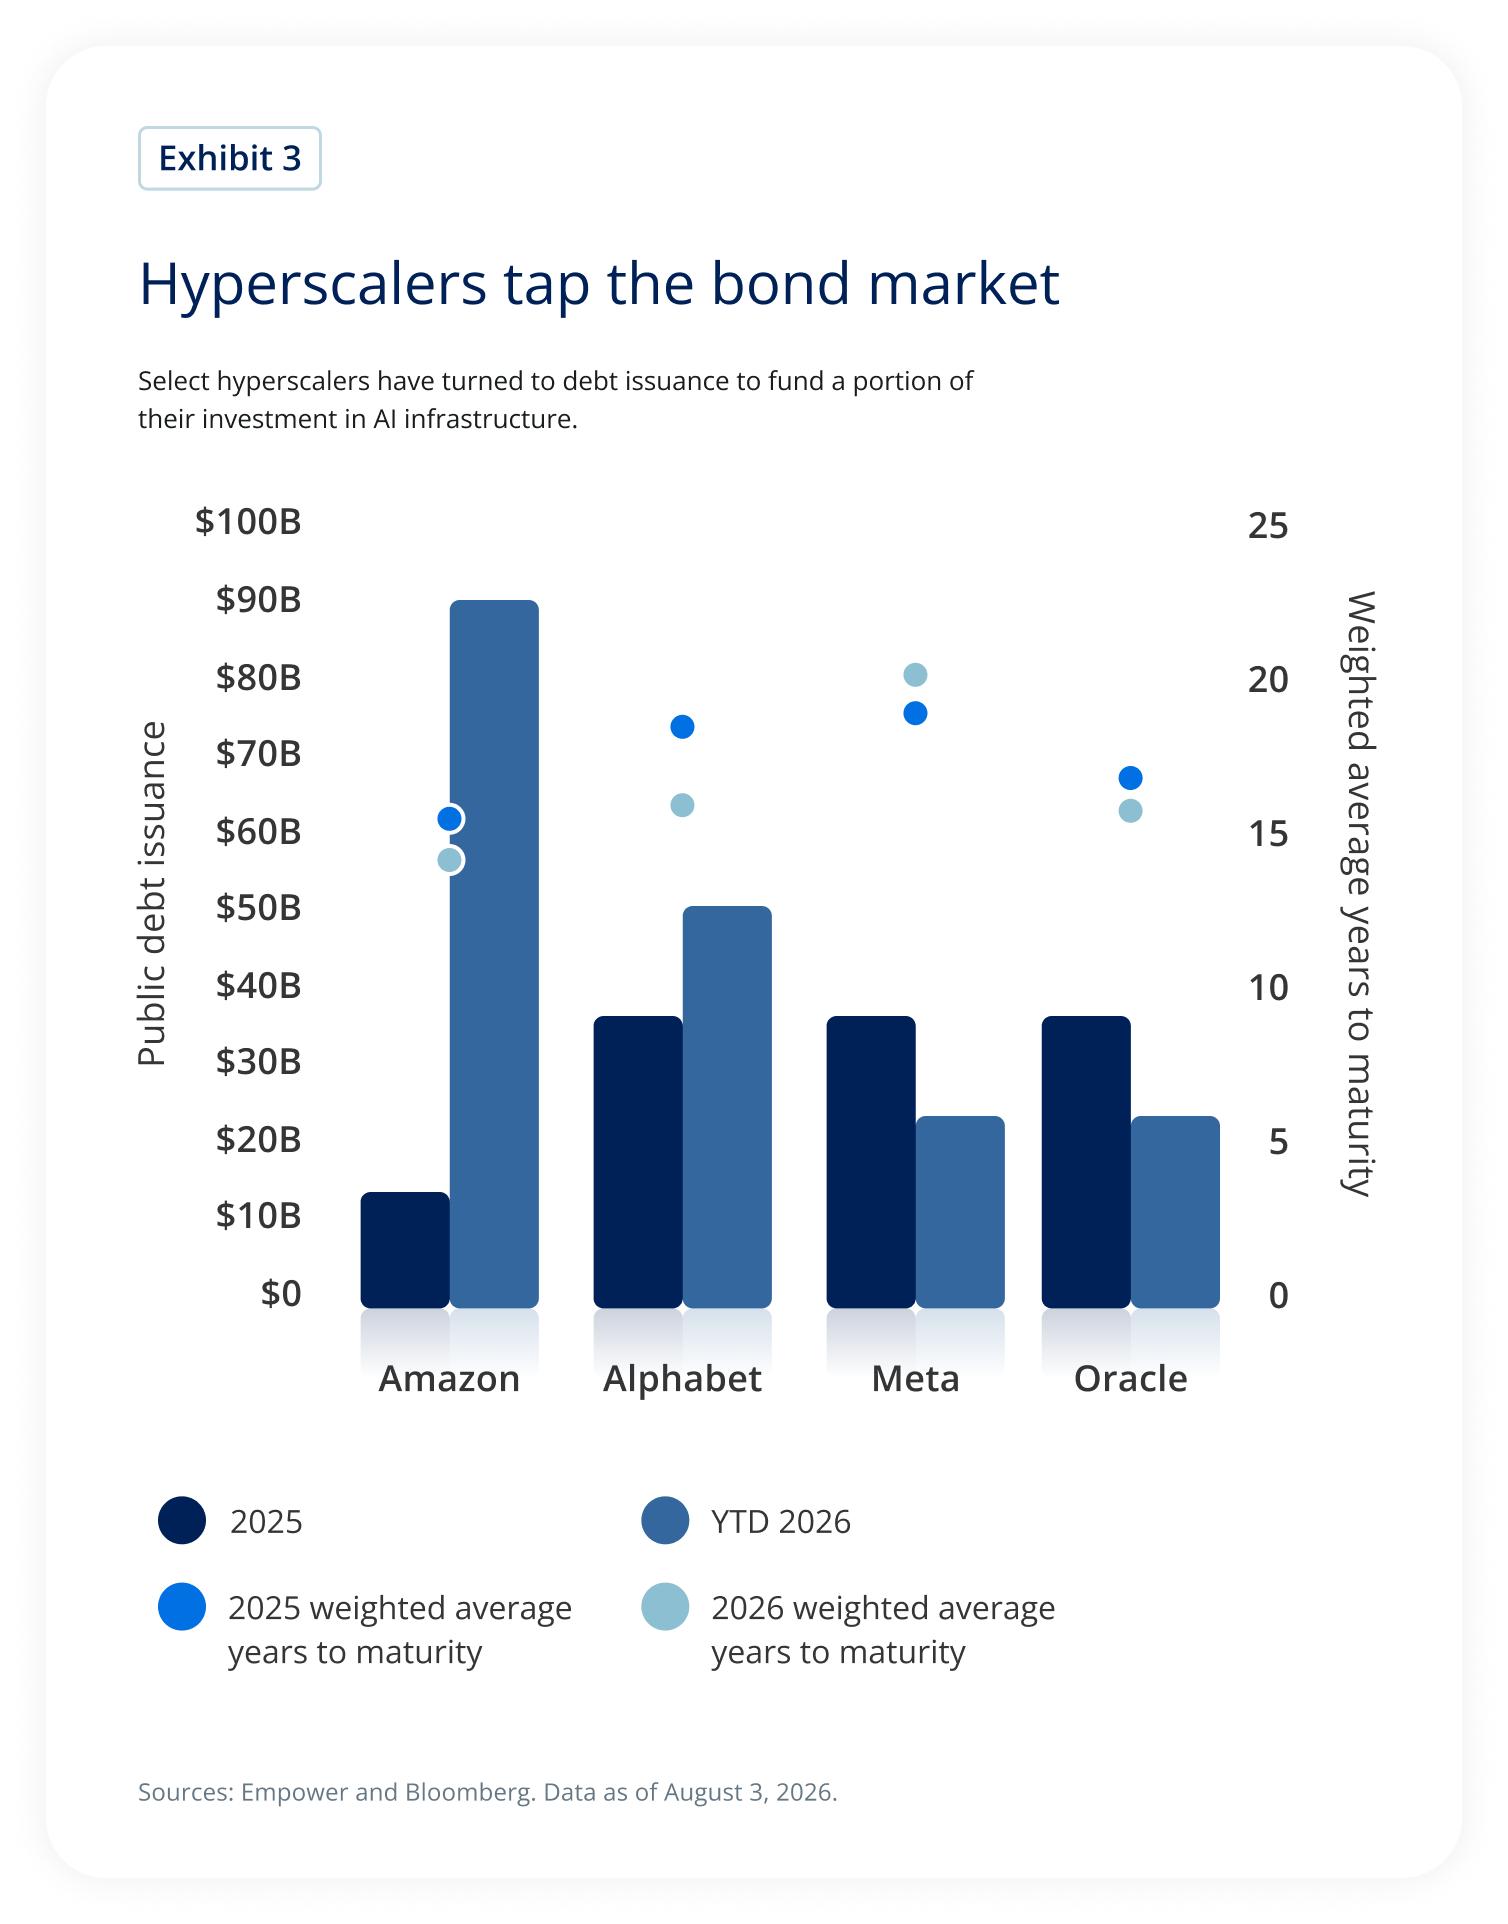
The chart compares public debt issuance and weighted-average years to maturity for Amazon, Alphabet, Meta, and Oracle in 2025 and year-to-date 2026, as of August 3, 2026.
Amazon shows the largest increase in debt issuance, rising from roughly $13 billion in 2025 to $90 billion in 2026 year to date. Alphabet's issuance increases from approximately $36 billion to $50 billion. Meta and Oracle each issued about $36 billion in 2025 and roughly $23 billion in 2026 year to date.
The chart also compares weighted-average maturity. Amazon's debt has a weighted-average maturity of roughly 15 years in both periods. Alphabet's is approximately 18 years in 2025 and 16 years in 2026. Meta's is approximately 19 years in 2025 and 20 years in 2026, while Oracle's is approximately 17 years in 2025 and 16 years in 2026.
Key takeaway: Major hyperscalers are tapping public debt markets as one source of funding for AI infrastructure investment. Amazon stands out for the particularly large increase in debt issuance during 2026, while the companies generally continue to issue debt with relatively long maturities.
In fact, it’s this issuance that some consider a potential driver of the higher yield curve. While the hyperscaler bonds live in the credit market, their expanding presence could drive the Treasury yield curve higher as they soak up demand that may otherwise gravitate toward the Treasury market.
There may be more yet to the story. Consider the term premium, which the Federal Reserve Bank of New York estimates has moved higher over the past several years, with another jump thus far in 2026.
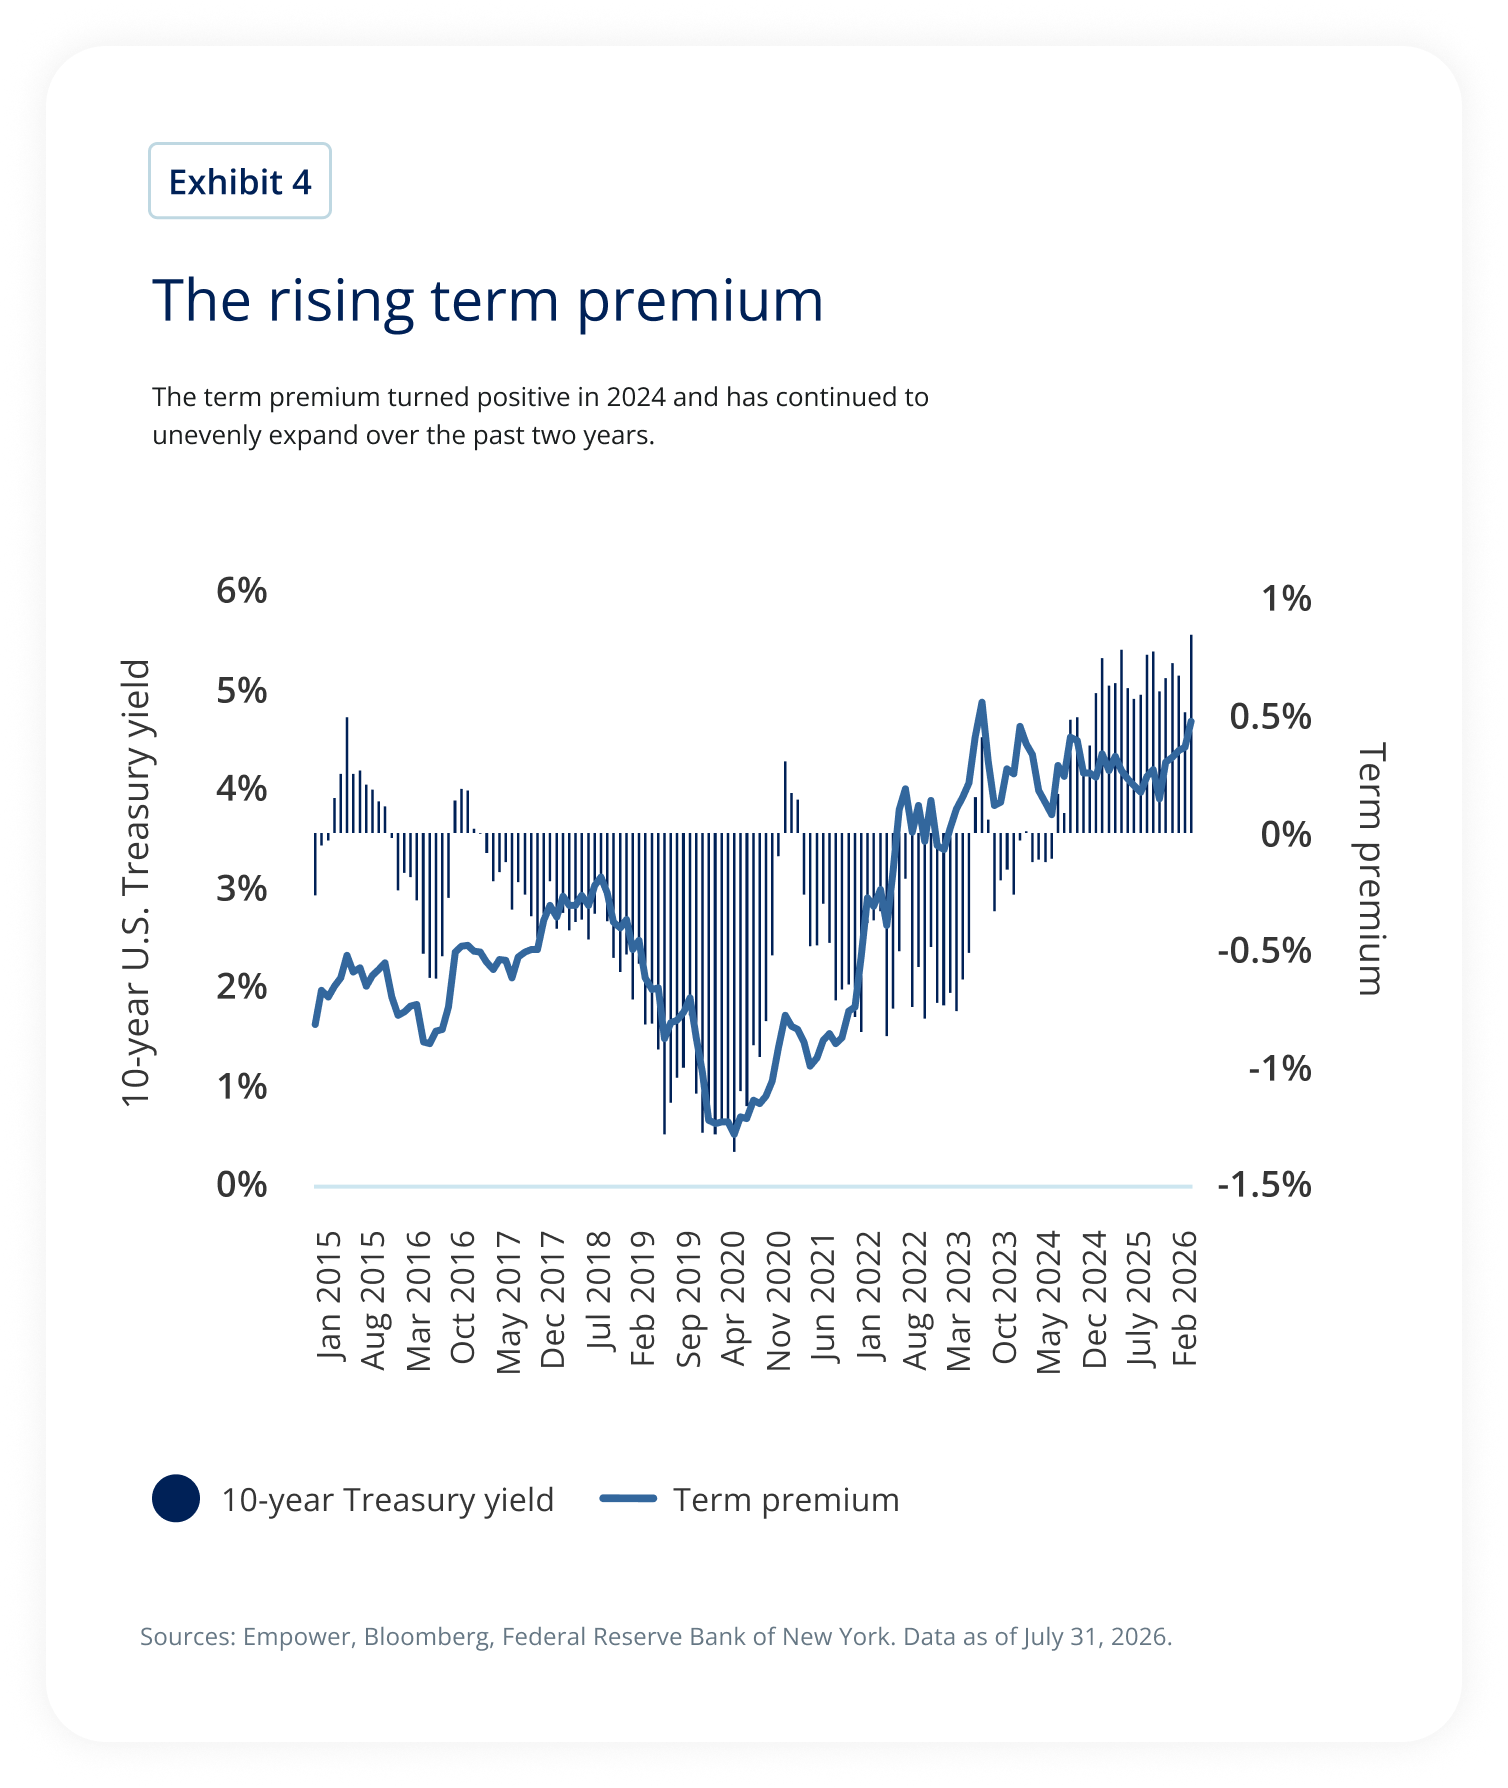
The chart tracks the 10-year U.S. Treasury yield and the term premium from January 2015 through 2026. The Treasury yield is measured on the left axis, while the term premium is measured on the right axis.
The 10-year Treasury yield generally declined from around 2% in 2015 to below 1% during 2020. It then rose sharply beginning in 2021 and 2022, reaching roughly 4% to 5% during portions of 2023 through 2026.
The term premium was generally negative for much of the period from 2016 through 2023, reaching its lowest levels around 2019 and 2020. It subsequently increased, turned positive in 2024, and continued to rise unevenly through 2025 and into 2026, reaching approximately one-half of a percentage point by the end of the period.
Key takeaway: The term premium turned positive in 2024 and has generally expanded since then. This indicates that a growing portion of longer-term Treasury yields reflects the additional compensation investors demand for holding longer-maturity bonds.
The term premium is the additional compensation investors demand for holding longer-term bonds instead of rolling over a series of shorter-term securities. One way to think about it is as an uncertainty premium; it captures investors’ collective ambiguity around the future path of rates; the near-, intermediate-, and long-term effects of AI; the evolving state of inflation; and other future unknowns, like questions around the massive U.S. debt burden.
If uncertainty is indeed becoming a bigger driver of long-term rates, it also changes how we should think about monetary policy. Monetary policy is always a game played in the dark, but it seems especially uncertain today, with the dynamics we face across AI, inflation, and fiscal sustainability. So what’s the Fed playbook for this kind of uncertainty? In his 2018 Jackson Hole address, Powell compared monetary policy decisions to a doctor prescribing medicine: “…when unsure of the potency of a medicine, start with a somewhat smaller dose.” I continue to prefer former ECB president Mario Draghi’s 2019 analogy, though: “In a dark room, you move with tiny steps.”
This brings us back to last month’s rate decision: a hold in July is not inconsistent with these frameworks. As noted, market-based measures suggest inflation expectations remain anchored. Meanwhile, the source of inflation isn’t entirely clear; at least part of today’s inflation reflects supply shocks, which may not be overly sensitive to a higher Fed funds rate.
However, without much explanation around its decision, it’s not clear this is the Fed committee’s collective assessment. And don’t forget about the three dissents; three more dissents than the decision in June. The internal conflict and limited explanation, combined with an uncertain inflationary backdrop, makes meetings live — in other words, not settled outcomes — in a way they wouldn’t otherwise be. As of August 12, futures prices indicate a 64% chance that the Fed will hold interest rates steady and a 36% chance that the Fed will raise rates in September. The upshot of that split view? Unless the market gets greater clarity soon, Fed decisions — and the associated press conferences — have the power to move markets.
In fact, I’d suggest that any time Warsh steps up to the microphone, markets could move. Take the Fed’s annual meeting in Jackson Hole, which this year is August 27-29. Warsh plans to hold the standard press conference at the conclusion of the meeting. Any clues he offers on what replaces the Fed's forward guidance, any discussion of evolving frameworks (including his recent suggestion to cut the number of Fed meetings from eight to six), or any description he provides of the prevailing economy could influence Fed futures pricing and the broader yield curve.
What I’m watching
So. Clearly the Fed and the yield curve — along with the underlying dynamics of inflation and the labor market — weigh heavily on my mind in this environment. I do wonder at what point the yield curve proves more problematic for equity markets, the rotation trade in particular. I’m also keeping an eye on the on/off Iran war, the back half of earnings season, and the swinging sentiment around AI.
Until September.
Our mission is to empower financial freedom for all Empower is a customer-obsessed financial services company delivering investment, wealth management, and retirement services to more than 19M people.2 The following tenets guide the development and management of products and solutions we provide to the investors we serve: Commit to an unwavering duty of care Our investors are our priority. We steward every dollar we invest with care, attention, and respect. Emphasize fundamental analysis We keep our eyes on the horizon by rooting our analysis in the underlying drivers of long-term investment returns, not fleeting news and noise. Plan for better outcomes through thoughtful diversification We build resilient portfolios by relying on thoughtful diversification that plans for a range of outcomes, rather than a narrow result. |
Explore previous editions
July 2026 | June 2026 | May 2026 | April 2026 | March 2026
Stay up to date |
1 As of March 31, 2026.
Investing involves risk, including possible loss of principal. This material is provided for informational and educational purposes only. It is not tailored to any investor’s objectives, financial situation, or needs and is not intended as investment, legal, tax, or accounting advice. Nothing in this material constitutes a recommendation, endorsement, offer, or solicitation to buy or sell any security, investment, sector, asset class, or strategy.
The opinions and views expressed are based on information available as of the publication date and represent Empower’s good-faith views at that time. Opinions, estimates, market conditions, and other information are subject to change without notice.
Information presented was developed internally and/or obtained from sources believed to be reliable; however, Empower does not guarantee its accuracy, adequacy, timeliness, or completeness. Historical market trends and economic data are not guarantees of future results and may not be indicative of future conditions.
This material may contain forward-looking statements based on current expectations, estimates, projections, and assumptions. Forward-looking statements are not guarantees of future performance or market outcomes and involve risks and uncertainties that are difficult to predict.
Fixed-income securities are subject to interest-rate, inflation, credit, liquidity, and market risk. The value of fixed-income securities will generally decline when interest rates rise. U.S. Treasury securities are backed by the full faith and credit of the U.S. government as to the timely payment of principal and interest when held to maturity, but their market value may fluctuate before maturity.
Market-based inflation measures, including breakeven inflation rates, are derived from market prices and may reflect inflation expectations as well as liquidity conditions, inflation-risk premiums, supply-and-demand factors, and other technical influences. They should not be interpreted as pure or guaranteed forecasts of future inflation.
Futures-implied probabilities are estimates derived from market prices as of the stated date and time. They may change rapidly, may be affected by liquidity and other market factors, and do not represent guaranteed outcomes or Empower forecasts.
Economic statistics, including gross domestic product, inflation, employment, and personal consumption expenditure data, are based on information available as of the stated release date and may be revised by the applicable government agency.
Term-premium estimates are model-based measures and are not directly observable. Results may vary depending on the model, assumptions, data inputs, and measurement period used.
Energy and commodity prices, including oil and gasoline prices, may be highly volatile and can be affected by geopolitical events, supply disruptions, demand conditions, regulatory developments, and changes in global economic activity.
This material is for informational purposes only and is not intended to provide investment, legal, or tax recommendations or advice.
“EMPOWER” and all associated logos and product names are trademarks of Empower Annuity Insurance Company of America.
©2026 Empower Annuity Insurance Company of America. All rights reserved.
INV-WMLPNV-WF-6808901-0826 RO5818981-0826