
Between the margins June 2026

June 2026
Today’s markets: The 10,000-foot view
June 2026
Today’s markets: The 10,000-foot view

Executive summary
- SpaceX has already seen tremendous growth, but the excitement around its IPO suggests investors think way more is to come.
- The rate picture is evolving, but that doesn't mean we are destined for hikes.
- In this climate, I consider robustness a key portfolio characteristic. And for many investors, that could include fixed income, even in an environment characterized by inflation uncertainty.
I’m writing this month’s commentary in piecemeal fashion, typing away after my exhausted kids fall into bed on our action-packed vacation. The distance not only gives me precious time with the ones I love the most; it also provides valuable perspective on the evolving 2026 market. The upshot? Lots of wonderful family memories — OK, fine, a few tears and temper tantrums, too (not all mine) — and three 10,000-foot observations as 2026 continues to unfold.
Observation 1: The momentum leading into SpaceX’s historic June 12 debut. Take a look at my Chart of the month, which visualizes SpaceX’s staggering late-stage velocity.
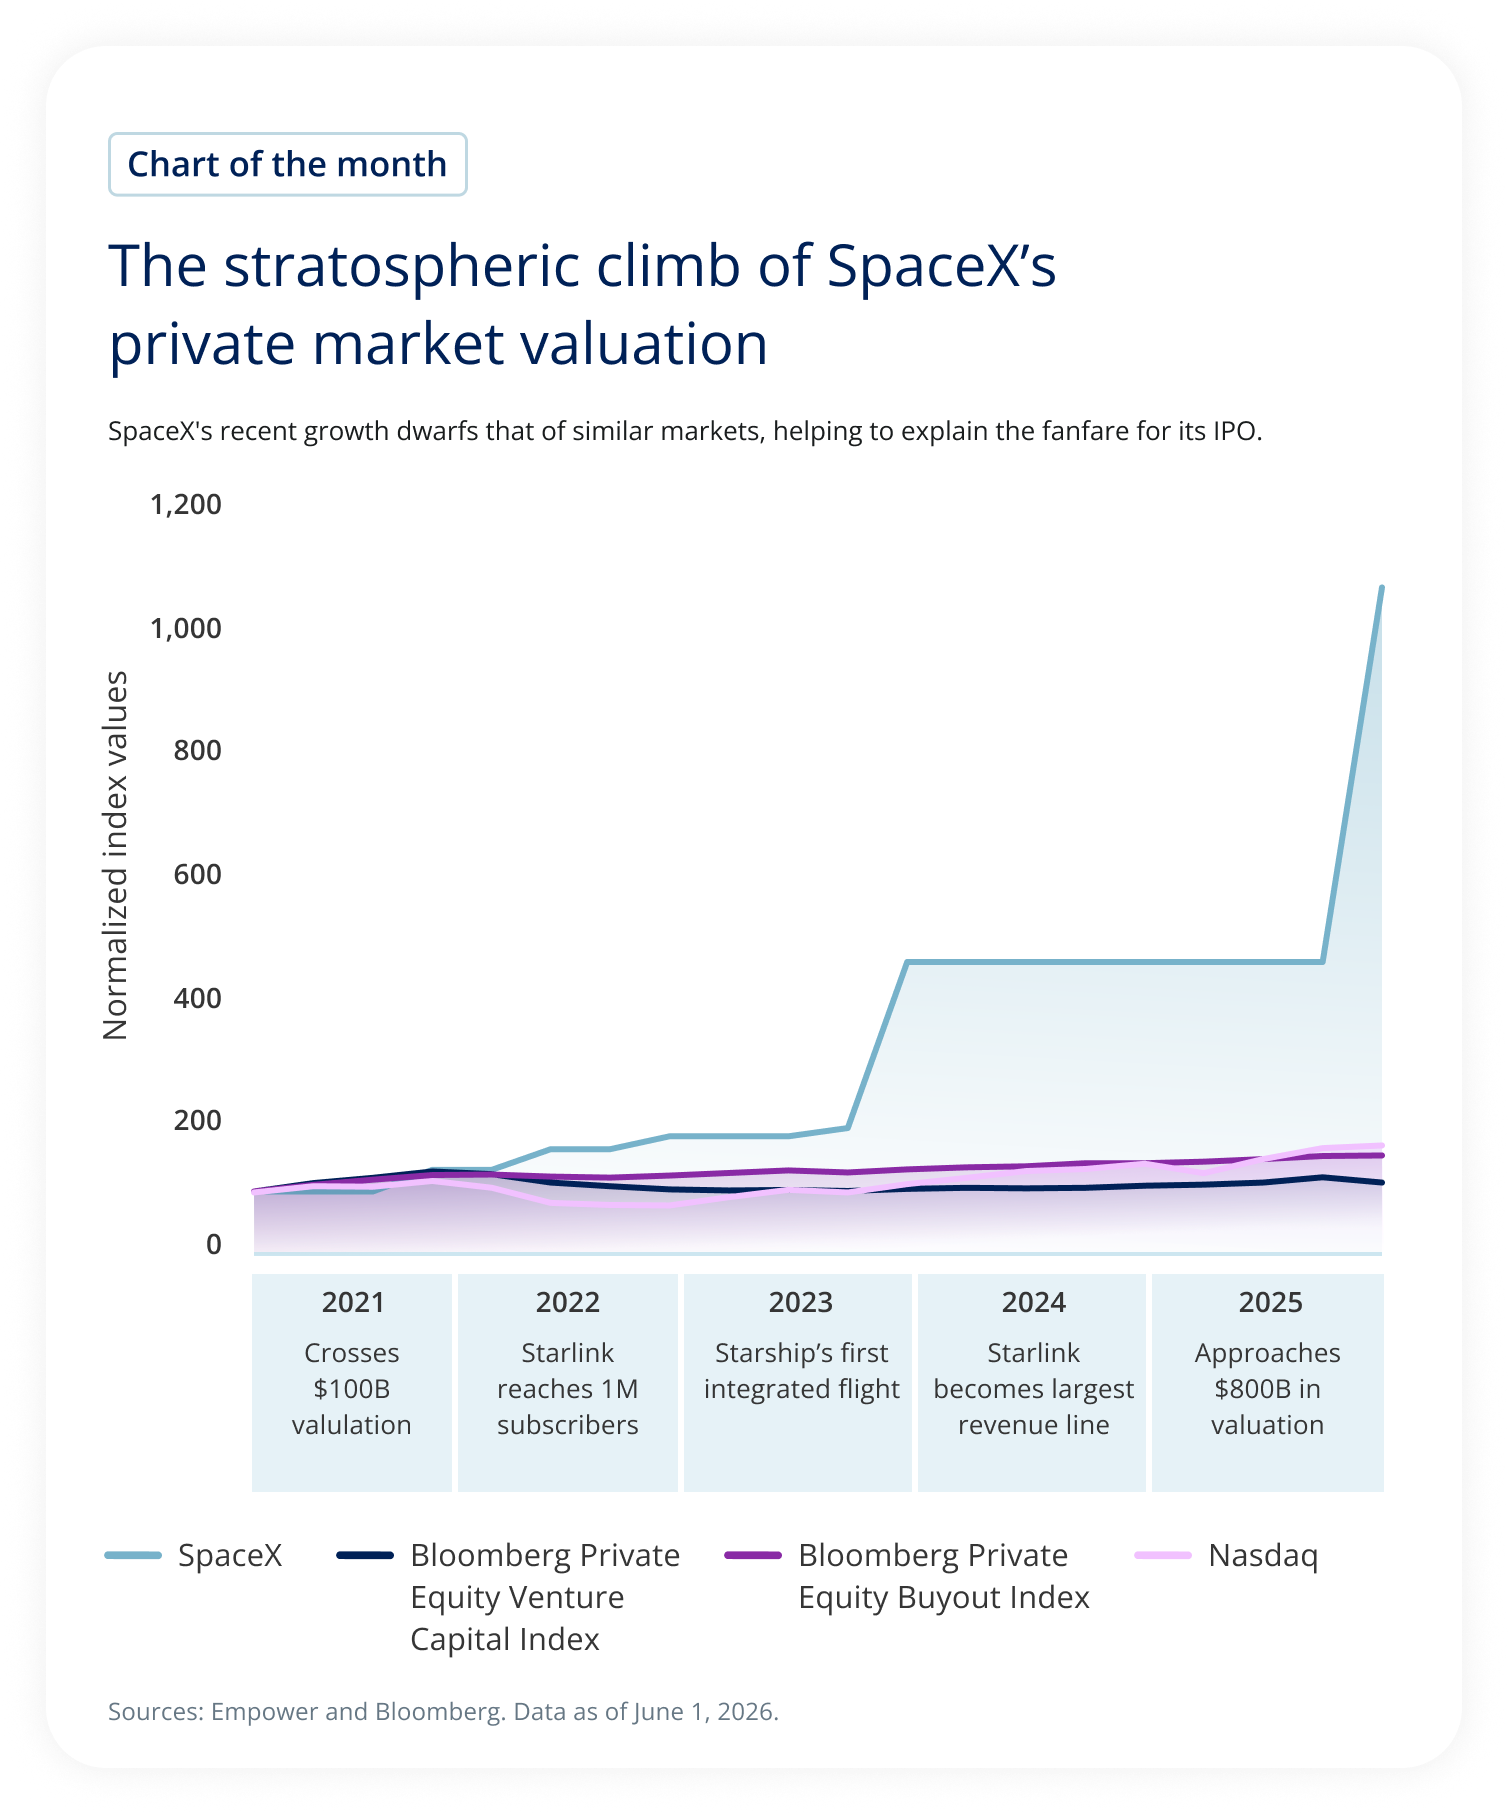
SpaceX's valuation growth substantially exceeded that of major private equity and public market benchmarks between 2021 and 2025, driven by milestones including Starlink growth, Starship development, and an increase toward an $800 billion valuation.
In the chart above, I indexed SpaceX, the Bloomberg Private Equity Venture Capital Index, the Bloomberg Private Equity Buyout Index, and the Nasdaq to the first quarter of 2021. Regardless of bogey, SpaceX maintains its divergence. Broader private markets spent the last few years absorbing higher interest rates, though performance here suggests later-stage companies managed the pressure well. However, they pale in comparison with public tech markets, which surged more than 75% from early 2021 to the end of 2025. In turn, public tech companies pale in comparison with SpaceX, which grew by more than tenfold, making their aggregated performance look flatlined by comparison.
When we think about the accelerating private market valuation that SpaceX has already achieved — some of it fundamental, like the Starlink acceleration and the company’s pivot into artificial intelligence (AI) infrastructure, and some of it likely in anticipation of its IPO — one key question comes to mind: What growth can we see from here that justifies the excitement we saw in anticipation of its IPO on June 12? Stay tuned on this front. In our Q3 Outlook, which comes out at the end of June, we will of course cover the market structure implications from a trio of IPOs — SpaceX, Anthropic (anticipated in the fall), OpenAI (the company recently filed an S-1, the first step toward going public). But we won’t stop there; we’ll also consider what it will take for them to succeed over the longer term, what we are calling “Day 2” considerations.
The evolving rate outlook
While SpaceX’s stratospheric aspirations and its potential to reshape public equity markets have the limelight for the moment, the market continues to evolve in other ways as well.
Consider Exhibit 2. Here I make the standard comparison between the upper bound of the Fed funds rate to the 2-year Treasury yield, the latter of which tends to price in investors’ collective expectations for Fed rate decisions.
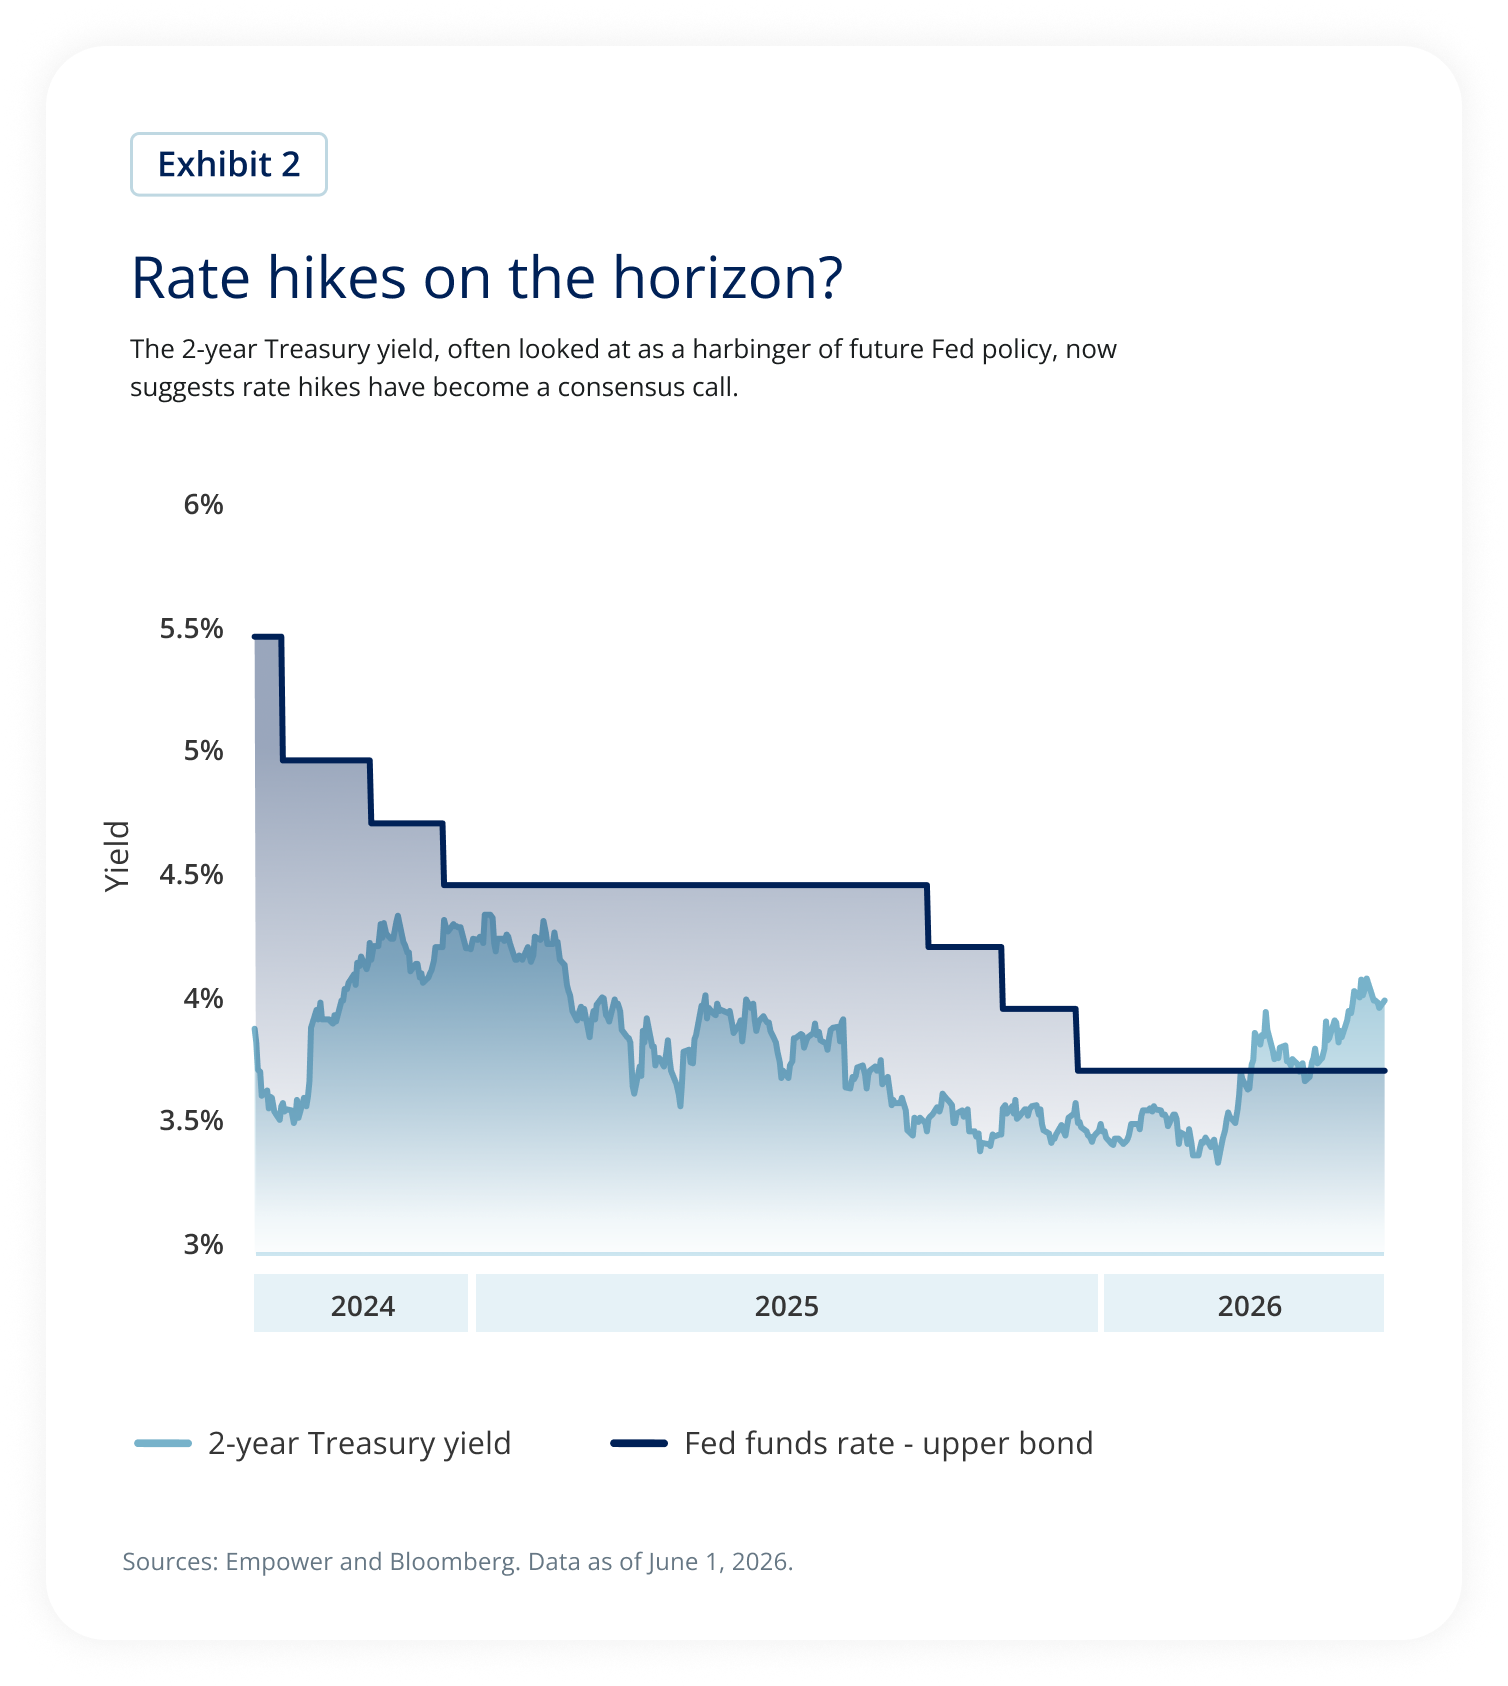
The chart compares the 2-year Treasury yield with the Federal funds rate upper bound between 2024 and 2026. The Federal funds rate declines in steps from approximately 5.5% in early 2024 to about 3.7% by 2026. The 2-year Treasury yield fluctuates throughout the period, generally trending downward through 2024 and 2025 before rising sharply in 2026. By mid-2026, the Treasury yield moves above the Federal funds rate and reaches approximately 4.0%, while the policy rate remains near 3.7%.
The chart's key message is that bond markets appear to be pricing in future interest-rate increases. Because the 2-year Treasury yield is often viewed as a leading indicator of expected Federal Reserve policy, its rise above the current Federal funds rate suggests investors increasingly anticipate future rate hikes.
After a disconnect in the fall of 2024, the 2-year Treasury steadily marched lower over the course of 2025, likely in part because it anticipated a resumption of Fed cuts. The Fed followed suit, delivering three cuts in the fall of 2025. But times have changed. With the war in Iran, a stabilizing job market, and core inflation that members of the Federal Open Market Committee now describe as “sticky,” the path forward looks a bit different.
Enter Observation 2. With the 2-year Treasury crossing above the upper bound of the Fed funds rate, market pricing increasingly reflects expectations that rates could move higher.
How reliable are these expectations?
I would take them with a grain of salt.
That’s not because there aren’t real signs of inflation concerns that should slow the Fed’s roll when it comes to rate cuts. Resolution may be coming on the Strait of Hormuz,1 but it remains tenuous, and inventories continue to dwindle. Thus, while the Fed’s playbook calls for policy to “look through” this type of disruption, the ultimate impact is still TBD. Combine that with the AI inflation surge, which, though localized to select segments of the economy, still impacts consumers, and the Fed now has enough inflation uncertainty to take a wait-and-see approach.
Still, when we think about core inflation overall, it’s not entirely clear we have the kind of accelerating demand that make today’s Fed policy rate of 3.5% to 3.75% overly loose. The job market has thus far proven more resilient than many feared last summer, as evidenced by a very strong May payrolls released earlier this month, but wage growth continues to slow, and higher energy prices can weigh on consumers over time. Of course, consumers are buoyed by the “wealth effect,” both from the housing gains of prior years and the stock market gains that continue today, but we think that generally leads to resiliency, not euphoria.
And as we consider future rate policy, we should remember the source of today’s surprisingly strong economy. A lot of it relates to the AI spend by the market’s powerhouses, which I expect will continue to spend regardless of whether rates are a quarter or a half point higher. What, exactly, would higher rates accomplish when it comes to cooling the economy?
Portfolio robustness
Now for Observation 3. When we think about an economy that is evolving, one characteristic leaps out to me as paramount for today’s portfolios: robustness.
The equity market is in the midst of a historic, multi-year transformation, with the promise of AI bringing massive opportunities, but there’s no shortage of risk — particularly as investors attempt to price an unknowable future.
Meanwhile, while I anticipate economic resilience, portfolios should also prepare for the possibility that the labor market surprises to the downside, stalled inflation progress weighs on consumer spending over time, or (and in my view most likely) the market is subject to massive fits and starts as sentiment vacillates between AI enthusiasm and AI exhaustion.
So how to help protect portfolios? Well, for one, I wouldn’t throw bonds overboard.
Yes, inflation is a pain point for fixed income. Think about it: As inflation grinds higher, fixed coupons lose their purchasing power — that’s the fundamental explanation for why bonds experience market-to-market losses during periods of higher inflation.
But with the curve already reset at higher yields, the losses aren’t as painful as you might guess. Moreover, bonds aren’t monolithic; different maturities have different risk profiles. In fact, even with short-term yields moving higher on inflation and the potential for rate hikes, the Bloomberg Treasury 1-3 Year Index lost just 0.5% in March while longer-term bonds suffered larger losses, as seen in Exhibit 3 below.
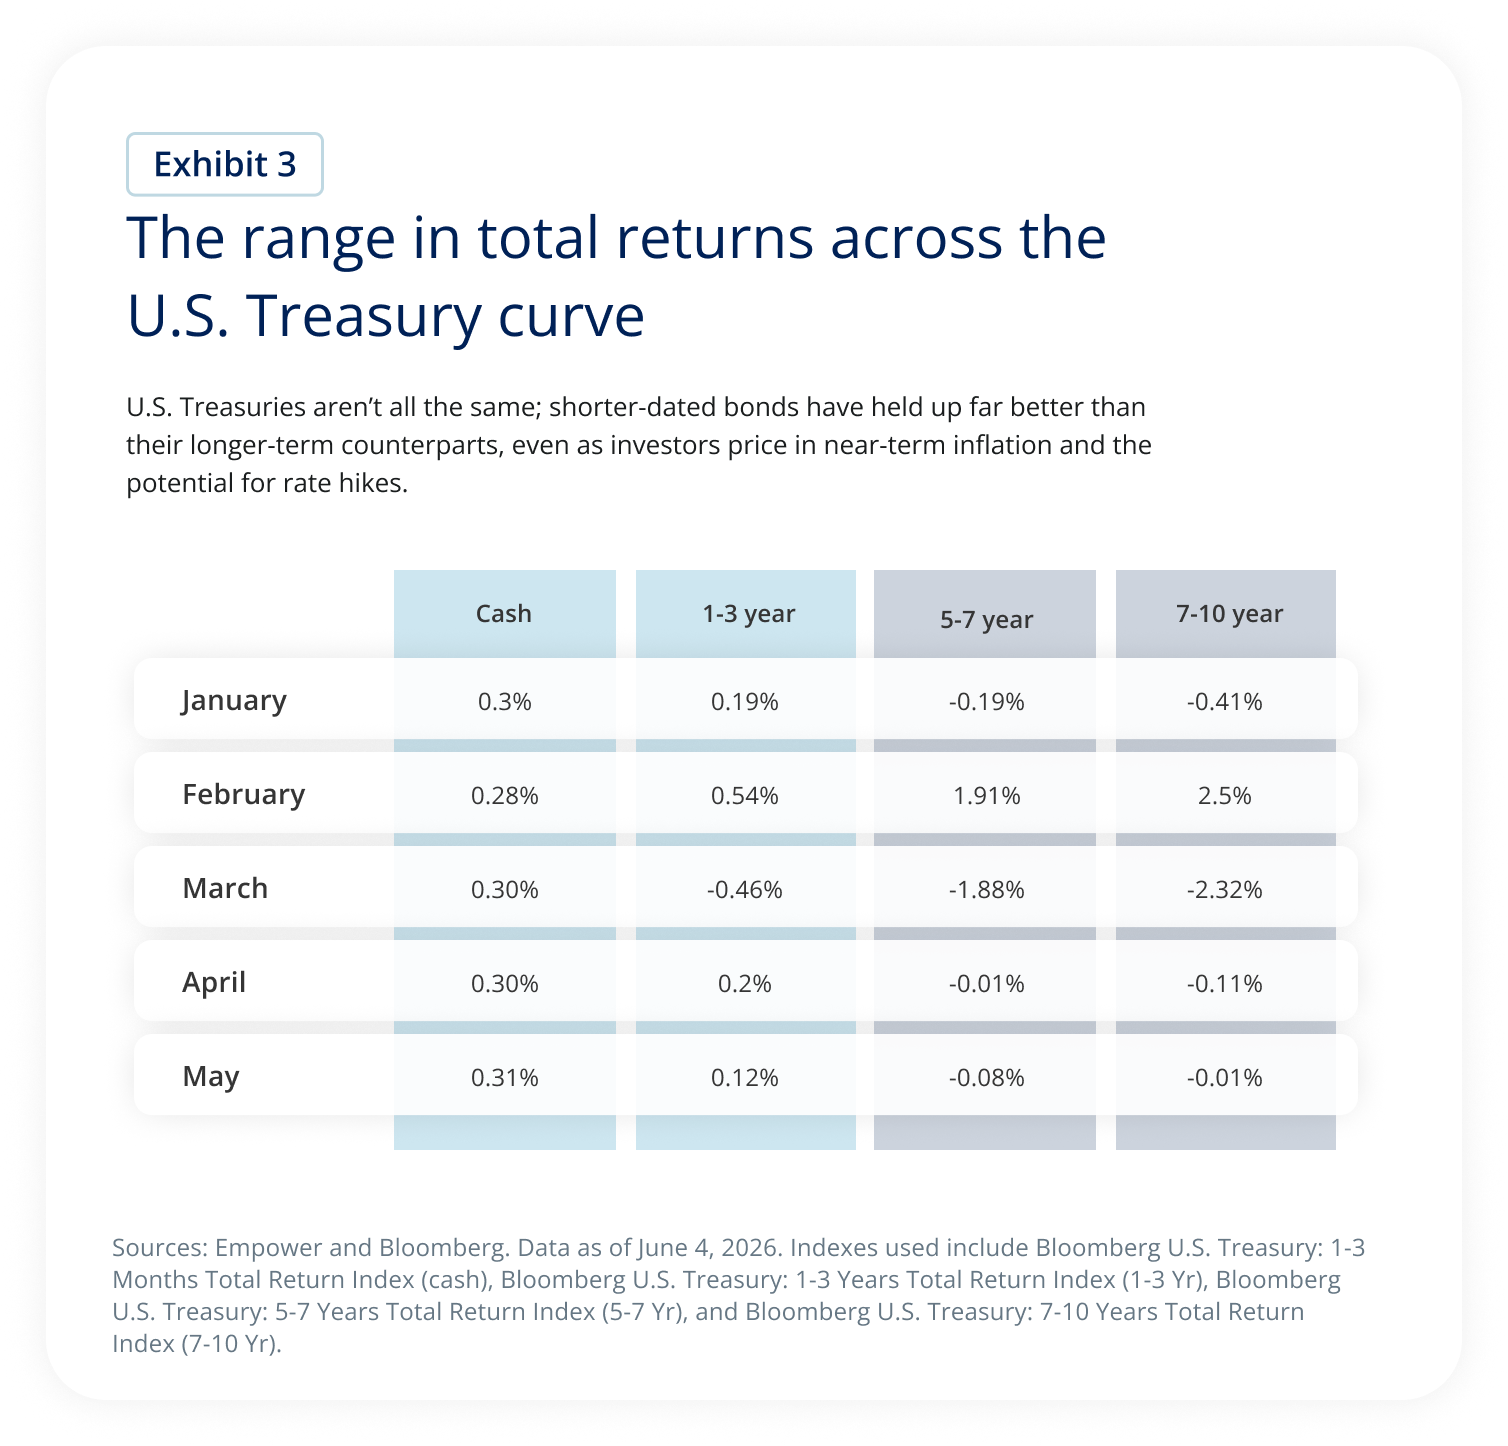
Exhibit 3 compares monthly total returns from January through May 2026 across four categories: cash, 1–3 year U.S. Treasuries, 5–7 year U.S. Treasuries, and 7–10 year U.S. Treasuries.
Cash produced consistently positive returns each month, ranging from 0.28% to 0.31%. Returns for 1–3 year Treasuries were mixed but generally modest, ranging from -0.46% to 0.54%.
Longer-duration Treasuries experienced greater volatility. The 5–7 year Treasury category returned 1.91% in February but declined by 1.88% in March. The 7–10 year category gained 2.5% in February but fell 2.32% in March.
The chart's key takeaway is that shorter-duration investments, particularly cash and short-term Treasuries, held up better than longer-term Treasury bonds during a period when investors were increasingly pricing in near-term inflation and the possibility of future interest-rate increases.
There’s also the potential that inflation fears peter out, leaving the door open for a bit of capital appreciation from the bond market. Plus, if the labor market is less resilient than I expect — or we see some other growth shock — portfolios may benefit from some fixed-income ballast.
I consider equity diversification a bit harder to come by. Much of the acceleration in today’s economy, in my view, comes from AI, which is the driving force of the earnings growth we see today. Few areas are truly AI immune, and those that do appear less vulnerable to disruption — say, consumer staples — sport arguably high valuations.
Healthcare stands out as one area that appears somewhat less expensive than other traditionally defensive sectors, though I no longer consider it cheap, particularly related to pharmaceuticals or biotechs. However, it appears a bit cheaper than other defensive areas and may offer some degree of diversification from the AI trade.
I’m also not wild about valuations overseas — 2025 corrected those markets in that regard — but I think currency diversification still has value over time.
Here’s another way to potentially add ballast to a portfolio: Consider the cheap parts of the AI trade. That’s not always easy to determine, given questions around the path for earnings. However, even with that caveat, a few areas jump out. Software is one, though picking select names over the grab-and-go ETF is paramount given the very real disruption in the space. I’d also argue for considering select names among the behemoths, which haven’t soared to the same nose-bleed levels as the broader memory chip or semi space over the course of the year. In fact, their valuations look a bit more reasonable, even if earnings retreat a bit.
Looking forward
Keep an eye out for our Q3 Outlook, with the Research Spotlight on IPOs, at the end of June. And, of course, as we progress through summer, I’ll want to follow the consumer closely. The greater the distance from tax refunds and the longer the Strait of Hormuz remains closed, the greater the pressure on the consumer. And then there is the broader AI trade. Earnings for AI companies got a big boost in Q1, but it wasn’t all the result of their core businesses. Getting another look at earnings for Q2 will help us gauge the true AI momentum and give us another read on the bottlenecks that slow the AI buildout.
Our mission is to empower financial freedom for all Empower is a customer-obsessed financial services company delivering investment, wealth management, and retirement services to more than 19M people.2 The following tenets guide the development and management of products and solutions we provide to the investors we serve: Commit to an unwavering duty of care Our investors are our priority. We steward every dollar we invest with care, attention, and respect. Emphasize fundamental analysis We keep our eyes on the horizon by rooting our analysis in the underlying drivers of long-term investment returns, not fleeting news and noise. Plan for better outcomes through thoughtful diversification We build resilient portfolios by relying on thoughtful diversification that plans for a range of outcomes, rather than a narrow result. |
Explore previous editions
Stay up to date |
1 Wikipedia.org/wiki/Strait_of_Hormuz.
2 As of March 31, 2026.
Investing involves risk, including possible loss of principal.
Past performance, where discussed, is not a guarantee of future results. Historical trends and economic data discussed may not be indicative of future conditions, which may change.
This material is for informational/educational purposes only; it may not be suitable for all investors; is not tailored to any specific investor’s objectives or financial situation; and is not intended as investment, legal, tax, or accounting advice.
The opinions expressed represent the current, good-faith views of Empower at the time of publication, are provided for limited purposes, and should not be relied upon as investment or legal advice.
This content is based on information available at the time and may change based on more current conditions. This is neither an endorsement of any security, index, sector, or investment, nor a solicitation to offer investment advice or sell products or services offered by Empower or its affiliates. It is impossible to invest directly in an index. References to asset classes or sectors are for illustrative purposes only and are not recommendations.
The information presented was developed internally and/or obtained from sources believed to be reliable; however, Empower does not guarantee the accuracy, adequacy, or completeness of such information.
Predictions, opinions, and other information contained in this communication are subject to change without notice and may no longer be true after the date indicated.
Bloomberg® and the referenced indices are trademarks or service marks of Bloomberg Finance L.P. and its affiliates. Bloomberg and any third-party providers are not affiliated with Empower and do not approve, endorse, review, or recommend the financial products referenced. Bloomberg does not guarantee the timeliness, accuracy, or completeness of any data related to the indices or financial products.
Empower refers to the products and services offered by Empower Annuity Insurance Company of America and its subsidiaries.
“EMPOWER” and all associated logos and product names are trademarks of Empower Annuity Insurance Company of America.
©2026 Empower Annuity Insurance Company of America. All rights reserved. INV-WMLPNV-WF-6464756-0626 RO5560565-0626