


Between the margins October 2026

October 2026
Broadening earnings and higher yields: Can the two coexist?
October 2026
Broadening earnings and higher yields: Can the two coexist?

Executive summary
- Analysts expect better breadth in 2027 earnings.
- Fundamentally, rates cut against this; the tech space tends to have lower debt than other areas with improved earnings expectations.
- Let’s not oversell it — rates alone are unlikely to undo trends in corporate earnings.
- Still, it’s worth treading carefully in areas with heavier debt levels.

I am so sorry. This month, it’s yields again. I’m sick of it, too.
It can’t be helped. It’s the climate we’re in, folks!
But fortunately, not just yields. Here’s the angle: Do higher yields get in the way of expected earnings breadth?
Let’s level set. As shown in the Chart of the Month below, analysts expect normalizing earnings growth in 2027, with more even growth across sectors.
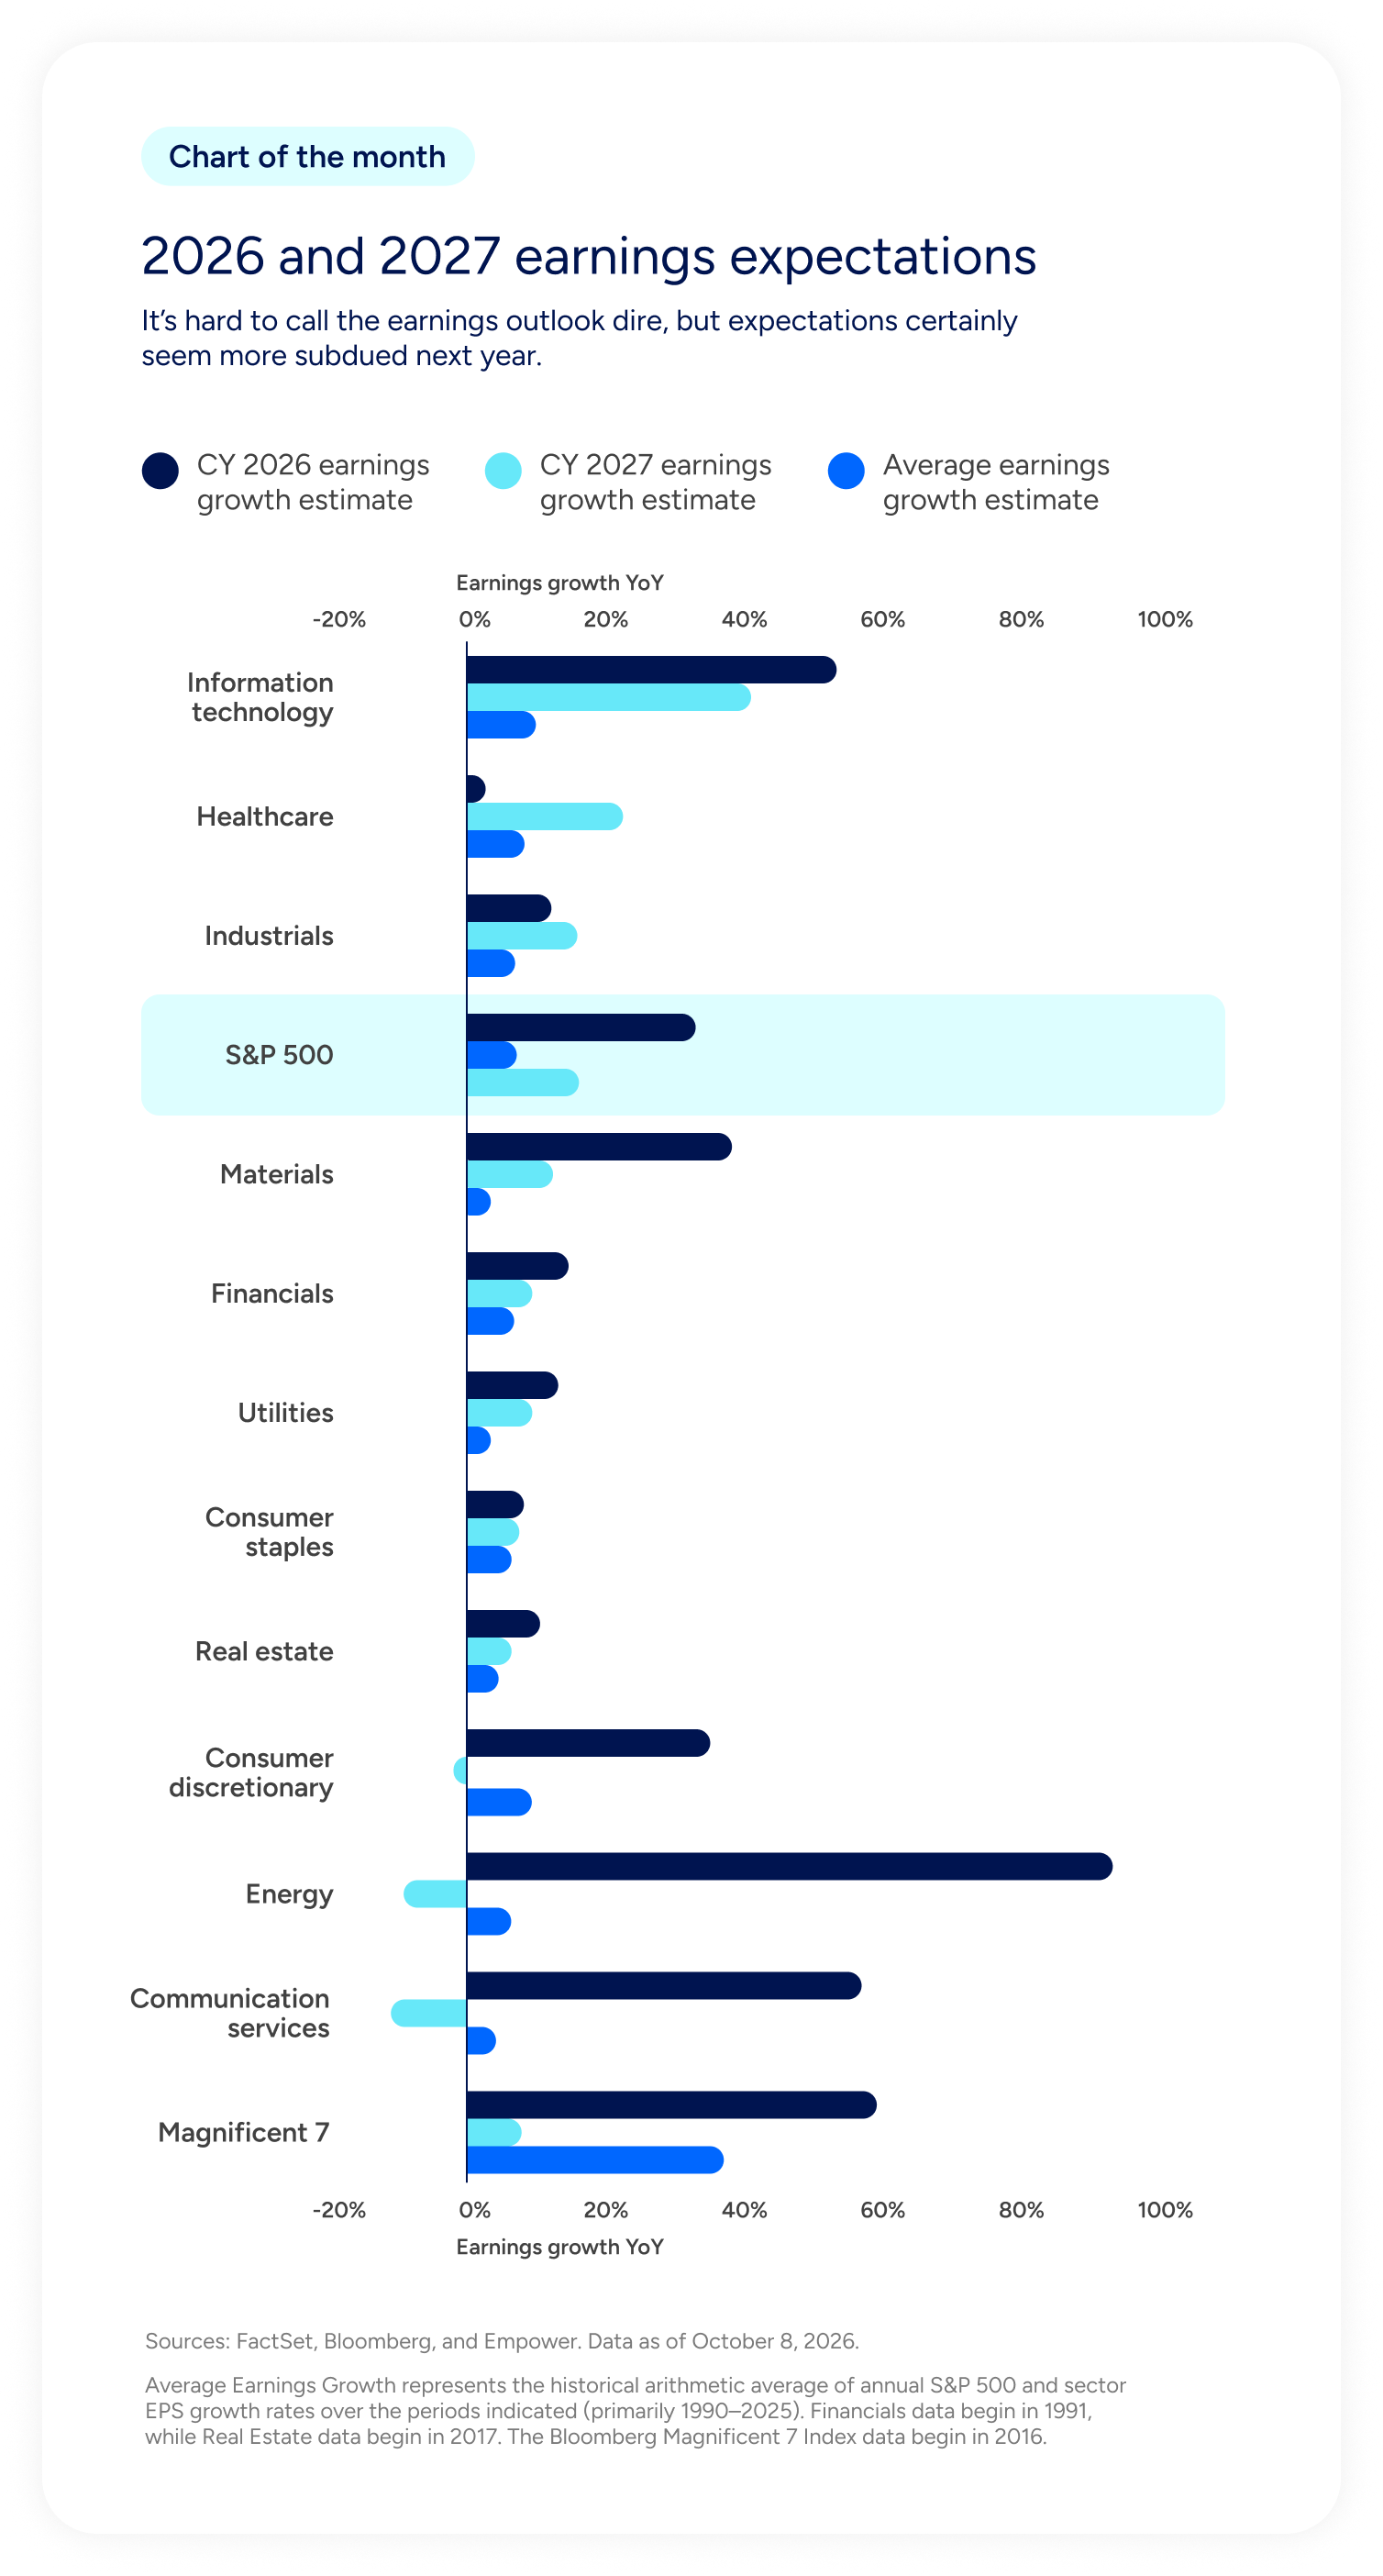
The chart compares estimated year-over-year earnings growth for calendar years 2026 and 2027 across the S&P 500, its major sectors, and the Magnificent 7. Historical average earnings growth rates are also included for comparison.
For the S&P 500 overall, estimated earnings growth declines from approximately 33% in 2026 to 16% in 2027, although both estimates remain above the historical average of roughly 7%.
Energy has the highest estimated growth for 2026 at approximately 93%, followed by the Magnificent 7 at 59%, Communication Services at 57%, and Information Technology at 53%. These groups are expected to experience substantially slower growth in 2027.
Energy and Communication Services are projected to experience slightly negative earnings growth in 2027, while Information Technology is expected to grow approximately 41% and the Magnificent 7 approximately 8%.
Other sectors show more moderate expectations. Healthcare is projected to improve from approximately 3% growth in 2026 to 22% in 2027. Industrials are expected to increase from roughly 12% to 16%, while Materials are projected to slow from approximately 38% to 12%.
Financials, Utilities, Consumer Staples, and Real Estate generally show positive but more modest earnings growth expectations in both years.
Key takeaway: Analysts expect earnings growth to moderate considerably in 2027 following exceptionally strong projected results in several sectors during 2026. However, the outlook varies substantially across sectors, with some areas expected to accelerate even as overall S&P 500 earnings growth slows.
Source: FactSet, Bloomberg, and Empower. Data as of October 8, 2026.
This expectation is a contrast to 2026, when growth concentrated in AI companies, most obviously in technology and some of the Mag 7 names — but also across the broader AI supply chain that shows up in small caps, industrials, and hyperscaler haunts like communication services.
For what it’s worth, market breadth in the U.S. feels like an asymptote. It seems every December, strategists (such as yours truly) describe the upcoming year as one for greater breadth in the U.S. market, but each year, it remains largely a technology story. (Point of order: I’ve been wrong plenty, but market breadth has never been my siren song!)
Does the analyst community have a stronger case to make in 2027? Perhaps. In 2026, a not-insignificant portion of the earnings growth came not from operations, but from investment returns. Take Alphabet. In Q2 2026, it reported an earnings growth rate of nearly 300% year-over-year. Wowzers.
Hello, AI revolution?
Hmm. Kinda. “Other income” represented the lion’s share of those gains; much of that other income came from investment gains outside companies (SpaceX and Anthropic in particular).
Still AI. True. But hardly the kind of earned revenue from its AI-aggressive capital expenditures that investors are anxious to see.
When you add in the reality that earnings growth next year will need to compare with the remarkable earnings growth this year (the “comparables” that can skew perception in year-over-year analysis), along with concerns around the impact of rising depreciation costs (those chips aren’t cheap!), it’s possible we could see lower growth from the AI arena even with greater monetization.
Again referencing our Chart of the Month, that looks especially true for the Mag 7 and sectors like communication services, where Alphabet and Meta sit. It also looks true for consumer discretionary, which houses Amazon. Technology still looks strong; hardware companies — particularly the chip names — look set to benefit from continued AI spending by the hyperscalers, though even for those companies, estimates have gone down. Case in point: Micron’s 2026 estimated earnings are 888%, falling to an estimated 135% in 2027. Still remarkable. But at least less ridiculous.
Meanwhile, areas outside AI have easier comparables. Healthcare, for example, has had a bit of a miserable earnings year, which should make next year’s earnings pop a bit more. And then there are areas like industrials. While plenty of AI supply-chain companies are in the mix here, analysts also point to defense spending and manufacturing recovery as earnings drivers for the sector.
Small caps are an especially favorite area for the earnings breadth argument, with higher estimates resulting from expectations for economic strength and the AI infrastructure build.
But not every variable points to improved earnings breadth next year.
Rates in particular point the other way. Not because higher yields necessarily derail earnings growth, but because they could make it harder for some companies to deliver on expectations than others. And that distinction matters when the argument is for broader earnings growth across the market.
First, consider the move we’ve seen in 2026. As of October 9, 2026, the 10-year Treasury yield topped 5.2%. That’s more than a full percentage point move from the start of the year, when the expectation was for lower rates over the course of the year.
Higher rates matter for companies with higher levels of indebtedness, greater floating-rate exposure, and weaker interest coverage. (Hey there, small caps!)
See below. While it’s not a complete picture of rate sensitivity, it helps identify where pressure points may be. On that note, while technology has the lowest leverage profile, consumer staples, real estate, and utilities sit at the higher end.
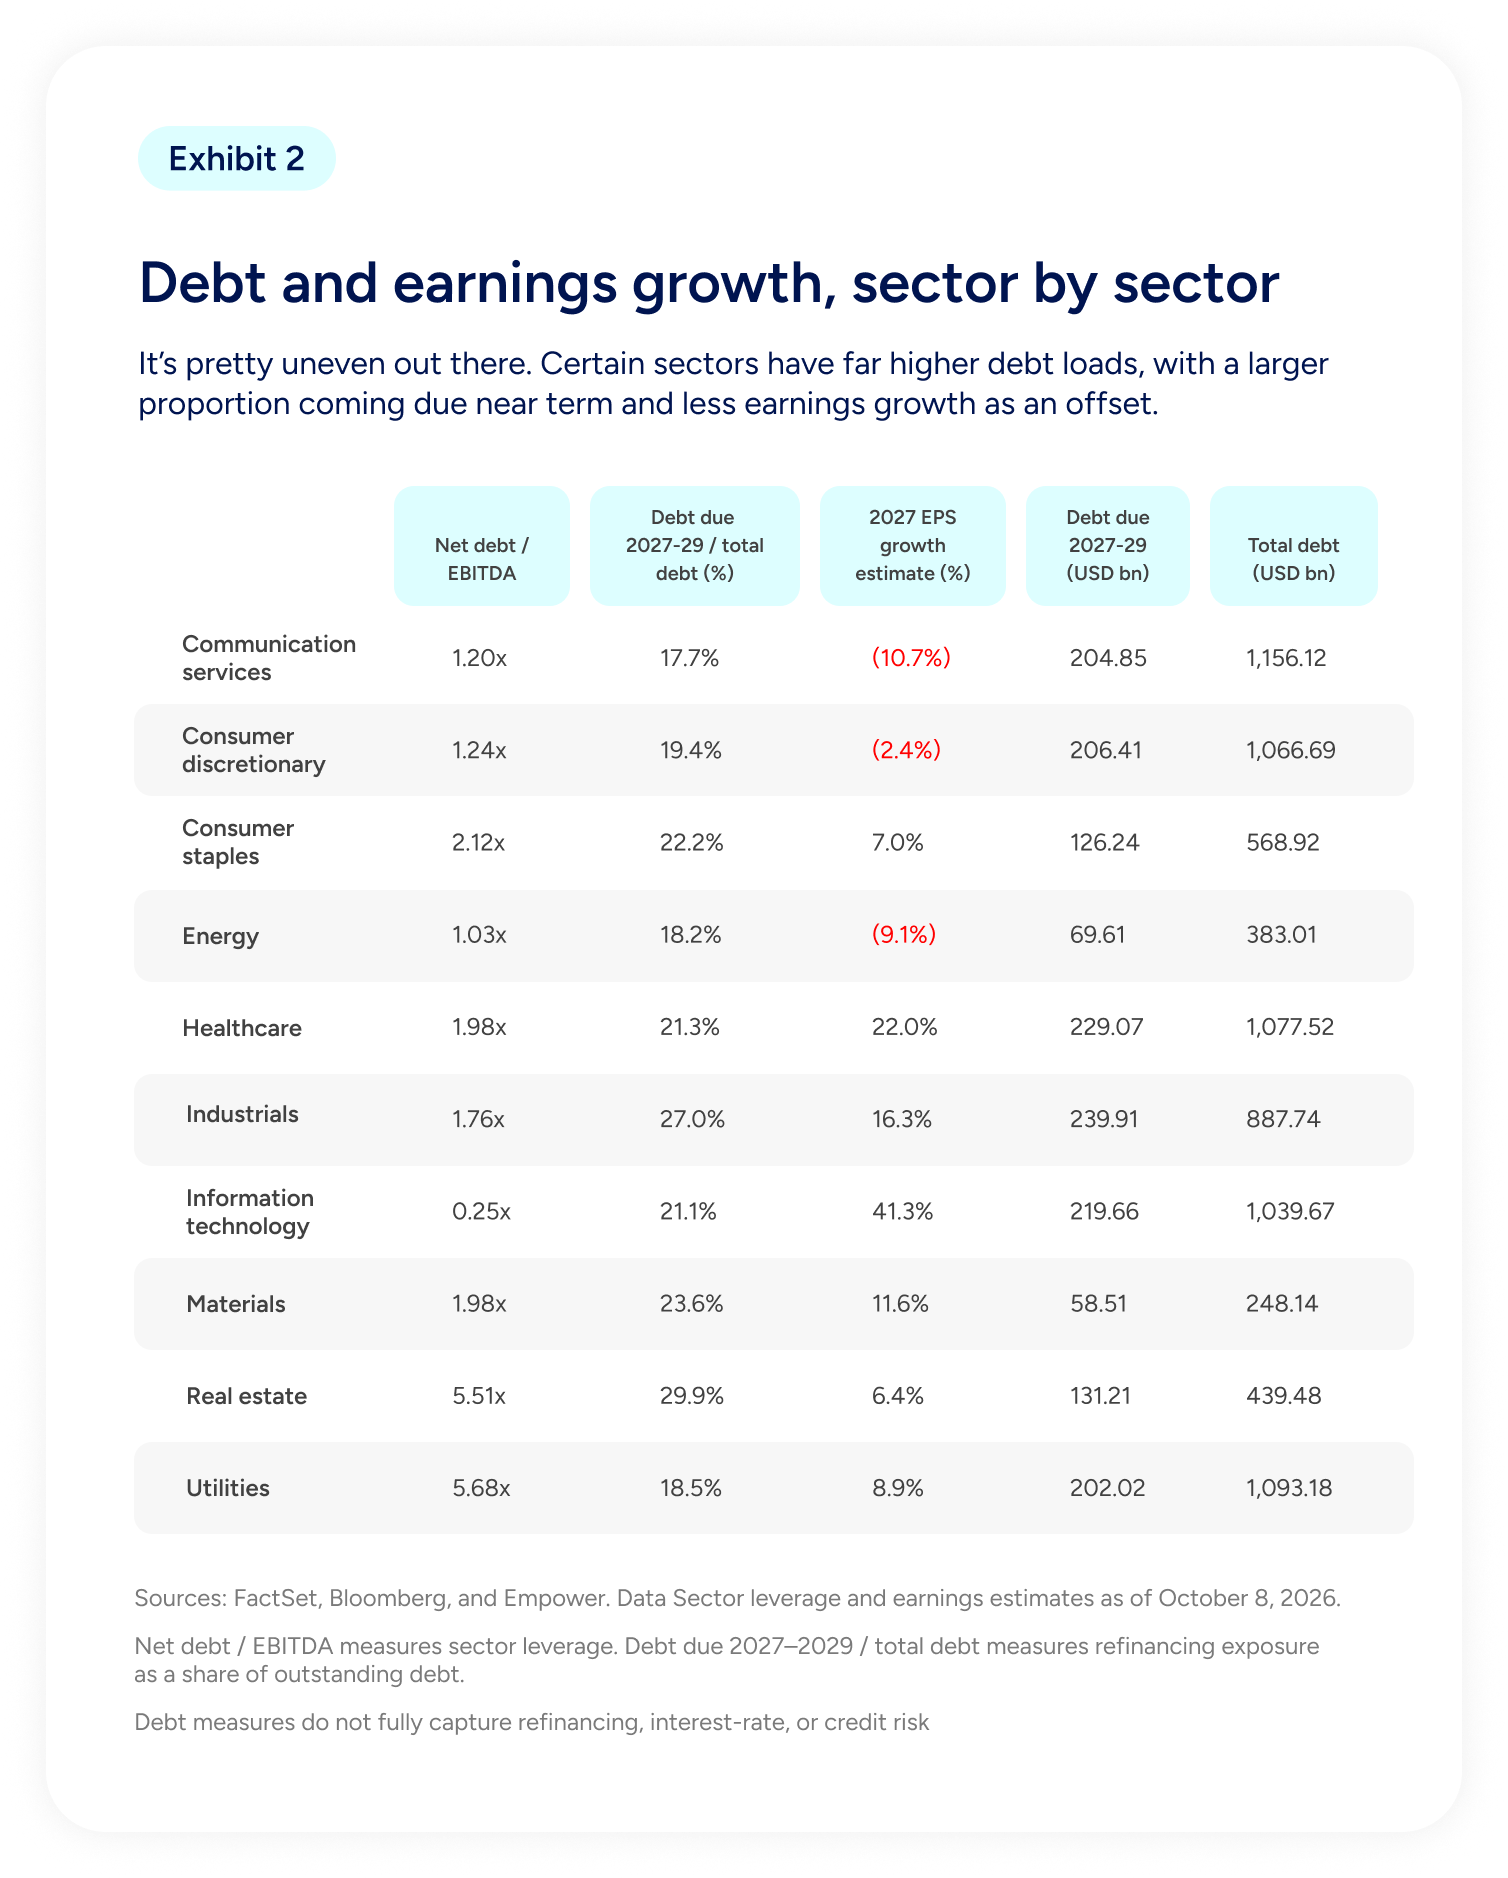
The table compares financial leverage, debt refinancing exposure, and projected earnings growth across 10 sectors using five measures: net debt to EBITDA, debt due between 2027 and 2029 as a percentage of total debt, estimated 2027 earnings per share growth, debt due between 2027 and 2029 in billions of dollars, and total outstanding debt in billions of dollars.
Utilities and Real Estate have the highest leverage ratios, with net debt to EBITDA of 5.68 times and 5.51 times, respectively. Real Estate also has the largest share of debt maturing between 2027 and 2029, at 29.9%, followed by Industrials at 27.0%.
Communication Services has the highest total debt, at approximately $1.16 trillion, followed by Utilities at $1.09 trillion, Healthcare at $1.08 trillion, Consumer Discretionary at $1.07 trillion, and Information Technology at $1.04 trillion.
In terms of upcoming maturities, Industrials has the largest dollar amount of debt due between 2027 and 2029, at approximately $240 billion, followed by Healthcare at $229 billion and Information Technology at $220 billion.
Earnings growth expectations also vary significantly. Information Technology has the strongest estimated 2027 earnings per share growth at 41.3%, followed by Healthcare at 22.0% and Industrials at 16.3%.
Three sectors have negative 2027 earnings growth estimates: Communication Services at -10.7%, Energy at -9.1%, and Consumer Discretionary at -2.4%.
Key takeaway: Financial leverage, upcoming debt maturities, and earnings growth expectations differ substantially across sectors. Utilities and Real Estate carry the highest leverage ratios, while Communication Services, Energy, and Consumer Discretionary face negative projected earnings growth. These differences highlight why sector-specific financial conditions matter when evaluating debt and refinancing exposure.
Source: FactSet, Bloomberg, and Empower. Data as of October 8, 2026.
But while the fundamental reasoning is sound, the historical data doesn’t draw a straight line from the 10-year Treasury to corporate earnings. In fact, when we look at historical periods of a similar move in the 10-year Treasury yield, we find plenty of instances in which earnings continue to compound regardless. One more reminder that we live in a multi-variable — not single-variable — world.
Be that as may, it’s worth considering why rates have headed higher in today’s environment. It’s not because growth expectations have suddenly accelerated. That would be a positive for earnings expectations. Rather, the higher 10-year Treasury yield reflects questions around supply and demand, fiscal uncertainty, and the future path of rates.
That distinction matters for earnings, but it also matters for valuations. Even before higher borrowing costs show up in reported profits, investors can start discounting companies that look more vulnerable to them.
And it appears they have. Since mid-August, as worries about structurally higher long-term rates grew, we’ve seen investors shift their preferences in favor of sectors and companies that face less pressure from higher yields. Take a look below. The companies that appear to have suffered the most between August 15 and October 8 are those with higher debt levels.
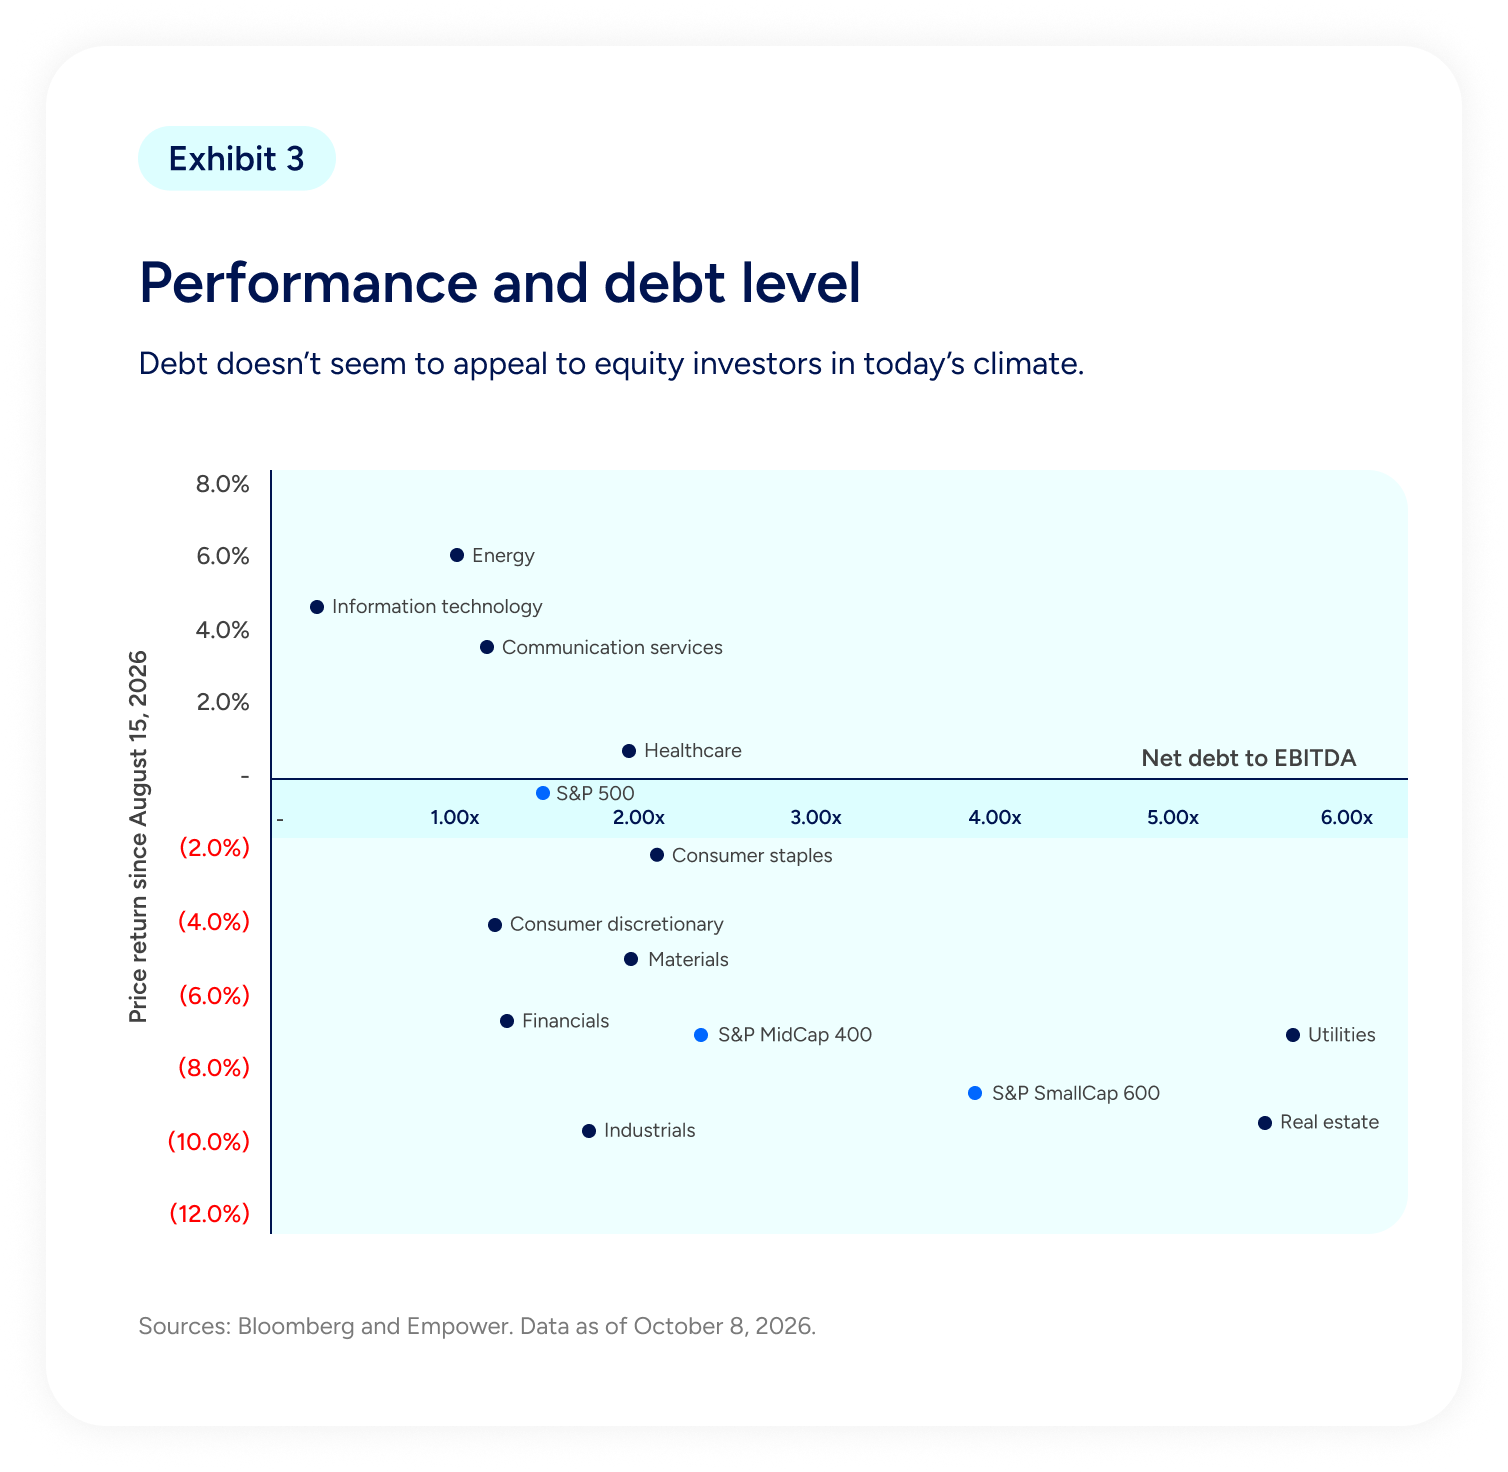
The chart compares net debt to EBITDA, a measure of financial leverage, with stock price returns since August 15, 2026, across major market sectors and three S&P indexes. Data is presented as of October 8, 2026.
The horizontal axis measures net debt to EBITDA, ranging from approximately zero to six times earnings before interest, taxes, depreciation, and amortization. The vertical axis measures stock price returns since August 15, 2026, ranging from approximately -12% to positive 8%.
Lower-leverage sectors generally experienced stronger performance. Energy, with net debt to EBITDA near 1.0 times, posted the highest return at approximately 6%. Information Technology, with leverage near 0.25 times, gained roughly 4.5%, while Communication Services, with leverage near 1.2 times, gained approximately 3.5%.
Healthcare, with leverage around 2.0 times, recorded a modest positive return of approximately 0.8%.
Several sectors with moderate leverage experienced negative returns. Consumer Staples declined approximately 2%, Consumer Discretionary fell roughly 4%, Materials declined about 5%, Financials fell approximately 6.5%, and Industrials declined nearly 10%.
Highly leveraged sectors experienced some of the weakest performance. Utilities and Real Estate, both with net debt to EBITDA above five times, recorded returns of approximately -7% and -9.5%, respectively.
The three broad market indexes also show differences. The S&P 500 declined slightly, by approximately 0.4%, while the S&P MidCap 400 fell roughly 7% and the S&P SmallCap 600 declined approximately 9%. The mid-cap and small-cap indexes also show higher leverage than the S&P 500.
Key takeaway: During the period shown, lower-leverage sectors generally outperformed highly leveraged sectors. The relationship is not uniform, but the chart suggests that investors may have favored companies and sectors with lower debt burdens.
Source: Bloomberg and Empower. Data as of October 8, 2026.
Of course, in the near term, this performance dispersion could be an opportunity for parts of the equity market that have sold off. The 10-year U.S. Treasury climbed half a percentage point in September alone. At least part of that move could be excesses that dissipate if rate policy appears priced in or geopolitical risks decline, giving equities that sold off a bit more breathing room.
Still. Particularly because of the supply-and-demand dynamics in the current climate — not to mention uncertainty around inflation and rates — I’d argue we’re looking at structurally higher yields than what we saw in the post-global financial crisis era.
That makes the balance sheet — and debt in particular — a reasonable consideration for investors looking for companies well positioned for the current regime. In my view, a good starting point for opportunity may be industries with reasonable valuations, strong fundamental momentum, and lower levels of debt.
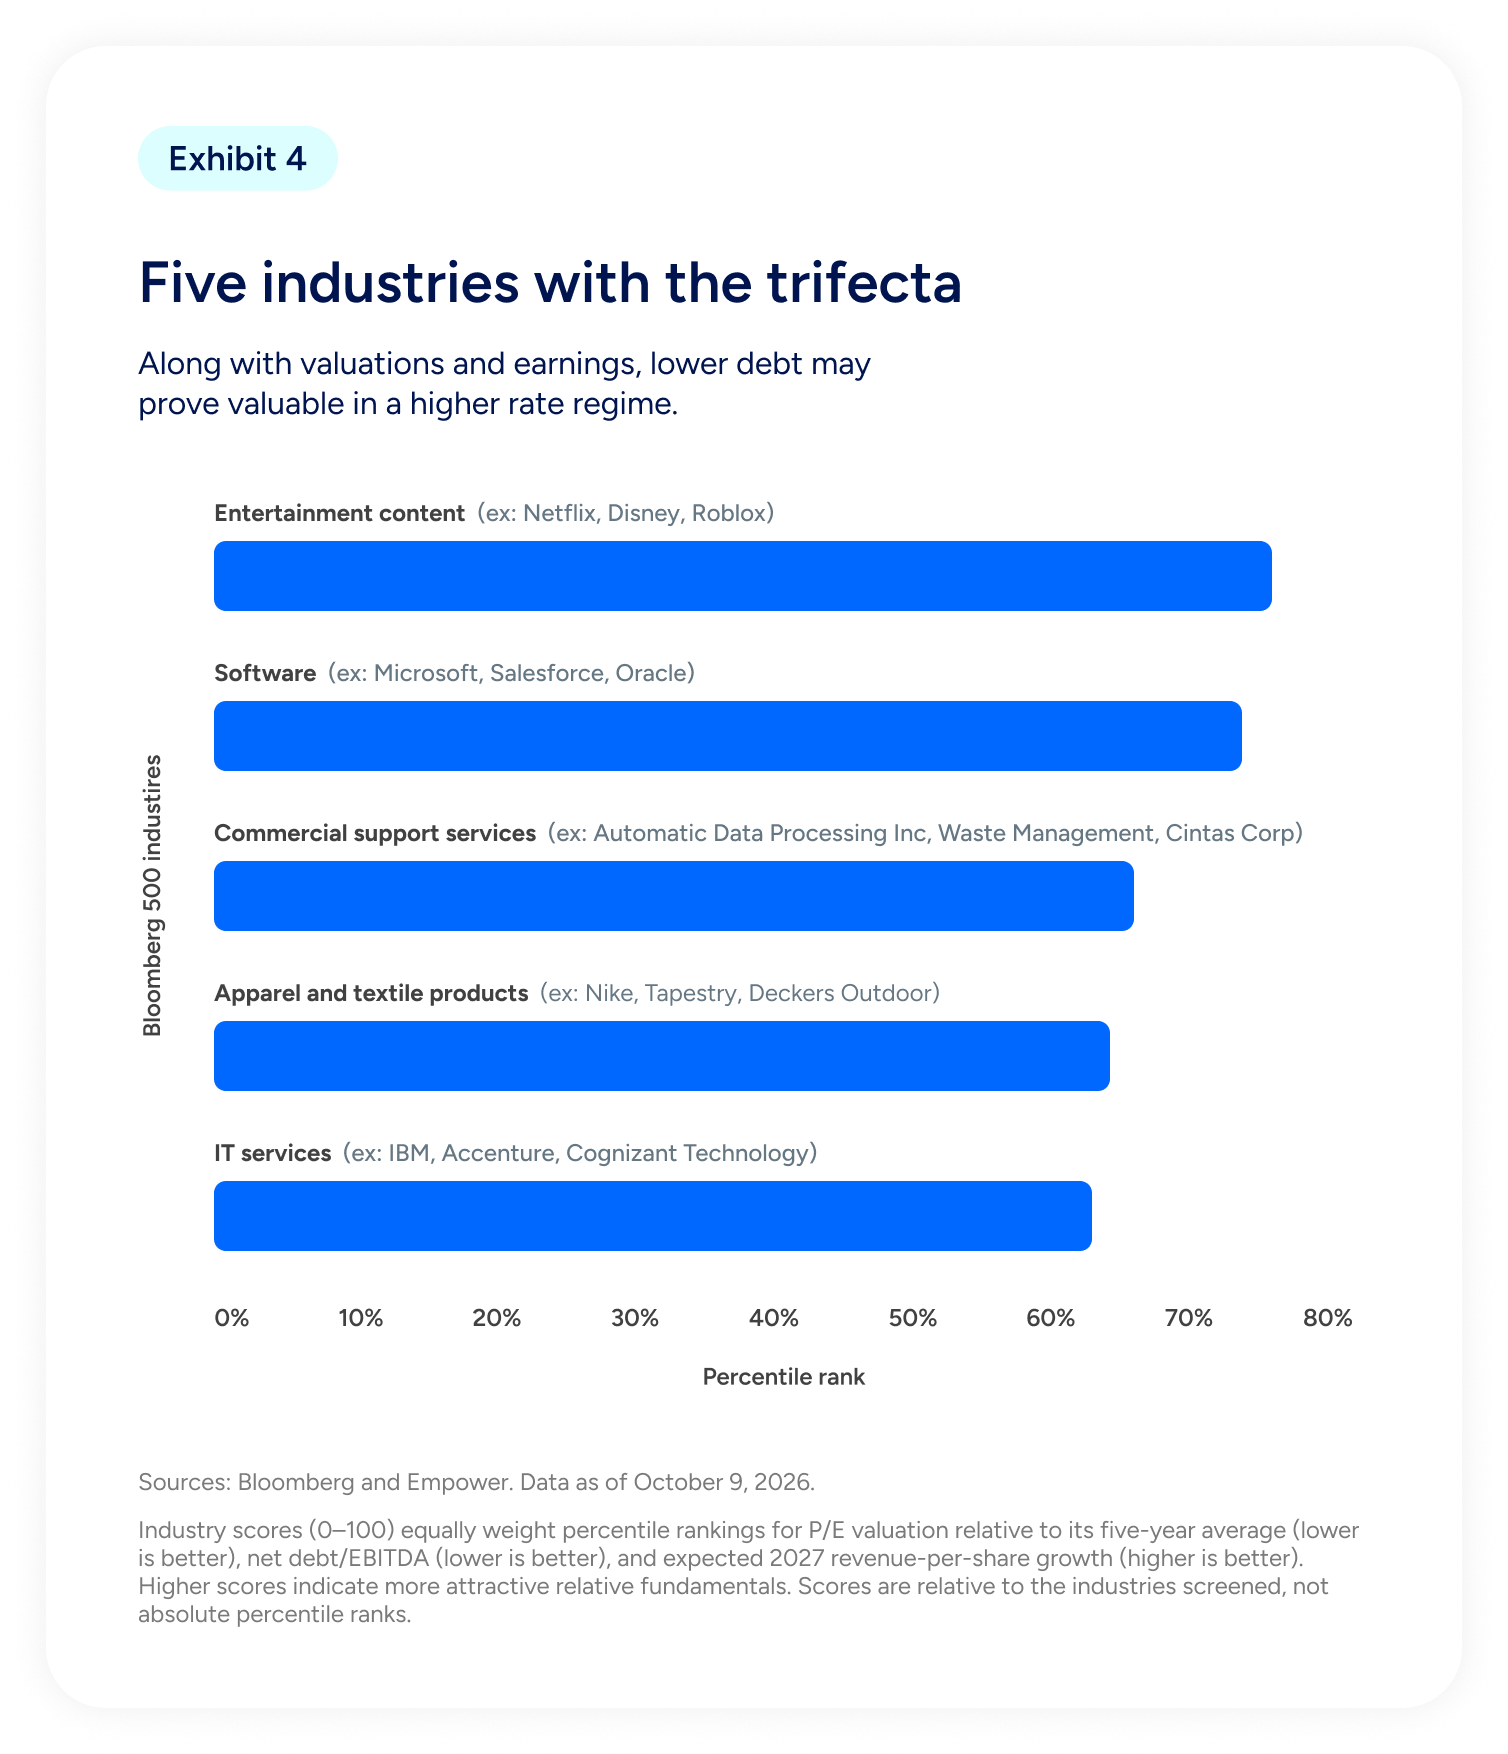
The chart identifies five industries within the Bloomberg 500 that rank favorably based on three equally weighted financial measures: price-to-earnings valuation relative to its five-year average, net debt to EBITDA, and expected 2027 revenue-per-share growth.
Entertainment Content ranks highest, with a combined score of approximately 76 out of 100. Examples include Netflix, Disney, and Roblox.
Software follows closely at approximately 74, with Microsoft, Salesforce, and Oracle listed as examples.
Commercial Support Services scores approximately 66, with examples including Automatic Data Processing, Waste Management, and Cintas.
Apparel and Textile Products scores approximately 64, with Nike, Tapestry, and Deckers Outdoor listed as examples.
IT Services scores approximately 63, with IBM, Accenture, and Cognizant Technology identified as examples.
The methodology assigns equal weight to three factors: lower price-to-earnings valuations relative to historical averages, lower net debt to EBITDA ratios, and higher expected revenue-per-share growth in 2027. Higher combined scores indicate more attractive relative fundamentals among the industries evaluated.
Key takeaway: Entertainment Content and Software lead the five industries identified as having favorable combinations of valuation, financial leverage, and expected growth. The exhibit suggests that lower debt burdens, alongside attractive valuations and earnings prospects, may be particularly valuable in a higher interest-rate environment.
Source: Bloomberg and Empower. Data as of October 9, 2026.
Here’s the takeaway
A broader earnings environment doesn’t necessarily mean a level playing field. Particularly when it comes to debt.
While it’s hard to argue that higher rates in and of themselves will be the undoing of 2027 expectations, they can certainly weigh on areas of the market that rely more on debt to fund their businesses. I’d pick my small caps carefully.
What else am I watching? In the immortal words of Elon Musk: Yikes. The CoreWeave situation. And earnings and the Treasury curve. Within earnings, it’s not just the AI trade that’s top of mind for me.
As earnings season unfolds, I’m particularly curious about the state of the consumer. I’ve thought the consumer is no better than resilient, but some point to consumer spending as a sign that the economy outside AI is humming. Will be nice to see some fundamental details there.
And then there are the midterms. Here’s my hot take: They don’t really matter to markets. OK, fine. On the margin. Companies need certainty, policy matters, etc. But it’s a circuitous journey from Washington to Wall Street — and I’m more concerned about what’s happening with valuations and earnings than I am with the inner workings of DC.
And this from an ex-bureaucrat!
Until November.
The S&P 500 Index is a registered trademark of Standard & Poor’s Financial Services LLC. It is an unmanaged index considered indicative of the domestic large-cap equity market and is used as a proxy for the stock market in general.
Investing involves risk, including possible loss of principal.
Past performance is not a guarantee of future results. Historical trends may not indicate future conditions.
This material is for informational purposes only and is not investment advice or a recommendation of any security, sector, or investment. It does not consider individual investor objectives or circumstances.
Opinions and forward-looking statements reflect current expectations, are subject to change, and are not guarantees of future results.
Information is obtained from sources believed reliable; however, its accuracy and completeness are not guaranteed.
Our mission is to empower financial freedom for all Empower is a customer-obsessed financial services company delivering investment, wealth management, and retirement services to more than 20M people.1 The following tenets guide the development and management of products and solutions we provide to the investors we serve: Commit to an unwavering duty of care Our investors are our priority. We steward every dollar we invest with care, attention, and respect. Emphasize fundamental analysis We keep our eyes on the horizon by rooting our analysis in the underlying drivers of long-term investment returns, not fleeting news and noise. Plan for better outcomes through thoughtful diversification We build resilient portfolios by relying on thoughtful diversification that plans for a range of outcomes, rather than a narrow result. |
Explore previous editions
Stay up-to-date |
Securities, when presented, are offered and/or distributed by Empower Financial Services, Inc., Member FINRA/SIPC. EFSI is an affiliate of Empower Retirement, LLC; Empower Funds, Inc.; and registered investment adviser Empower Advisory Group, LLC. This material is for informational purposes only and is not intended to provide investment, legal, or tax recommendations or advice.
“EMPOWER” and all associated logos and product names are trademarks of Empower Annuity Insurance Company of America.
©2026 Empower Annuity Insurance Company of America. All rights reserved.
INV-WMLPNV-WF-7207301-1026 RO6019701-1026