


Between the margins November 2026

November 2026
Handicapping year-end expectations
November 2026
Handicapping year-end expectations

Executive summary
1. The common question for this time of year: How will stocks finish the year?
2. As fun as it is to pontificate, I’m not sure it matters.
3. Take a look at 2021. A great finish to the year. And then? A brick wall.
4. We have our own brick wall this year. And just like at the tail end of 2021, it centers on tech.
5. The problems this year are a bit more concerning, though: They pertain to fair value.
We’re in the end-of-year stretch, and in nearly every media appearance I have, the question arises: How will markets finish the year?
Our Chart of the Month below gives a sense of the seasonal pattern.
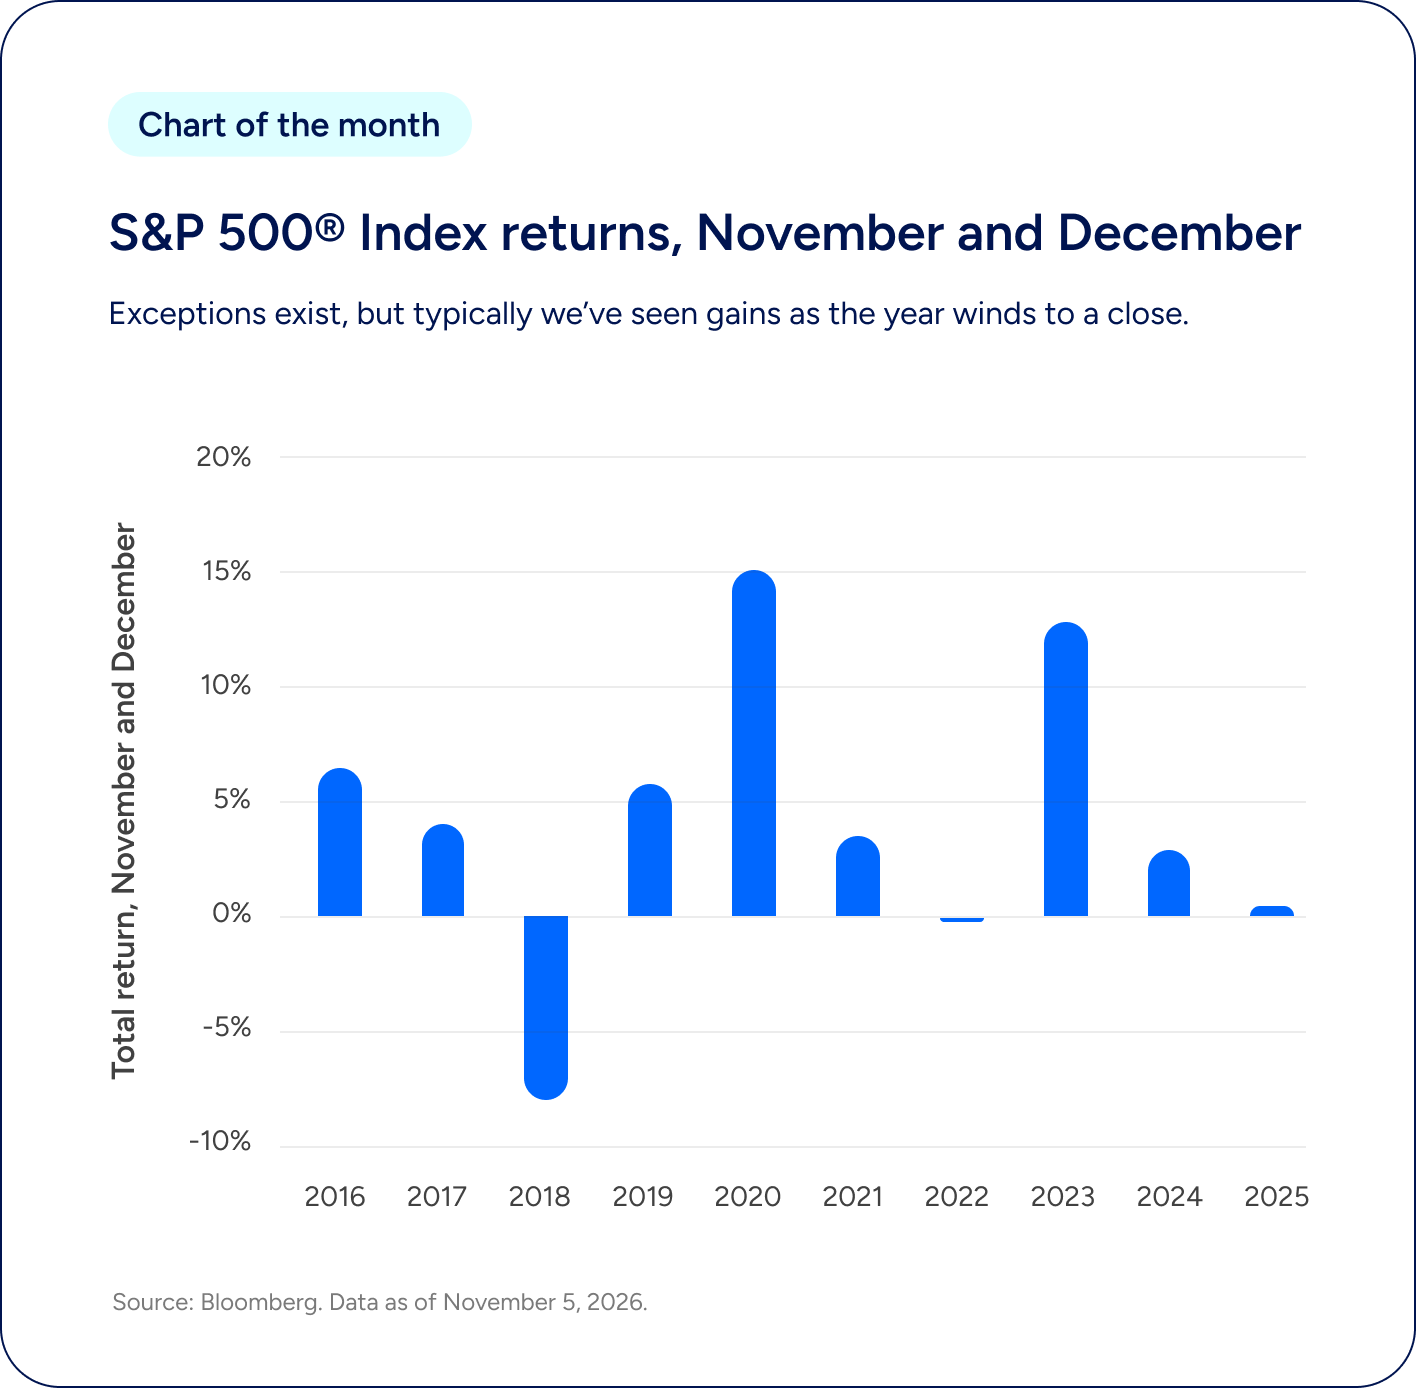
The chart presents combined November and December total returns for the S&P 500 Index over 10 years, from 2016 through 2025.
The index recorded positive returns in eight of the 10 years shown. The strongest performance occurred in 2020, with a return of approximately 15%, followed by 2023, at roughly 13%.
Other positive periods included 2016 at approximately 6%, 2017 at 4%, 2019 at 5.5%, 2021 at 3.5%, 2024 at 3%, and 2025 with a return slightly above zero.
The two negative periods were 2018, when the index declined approximately 8%, and 2022, when returns were slightly below zero.
Key takeaway: The S&P 500 generated positive combined November and December returns in most years between 2016 and 2025. However, the negative results in 2018 and 2022 demonstrate that year-end gains are not guaranteed.
Source: Bloomberg. Data as of November 5, 2026.
But while research suggests trends in rebalancing, tax-loss harvesting, and window dressing can have an effect, the macroeconomic backdrop, sentiment, and fundamentals can override what seem to be predictable trading trends. (I’m looking at you, 2018.)
And frankly, I'm not sure how much the final two months of the year tell us anyway.
Take 2021. The S&P 500 finished the final two months of the year up 3.6%. Technology did even better, rising nearly 8%. The Magnificent Seven gained another 3.1%.
A perfectly respectable finish to a very strong year.
And then came 2022.
The S&P 500 Index lost roughly 19%, while technology and the Magnificent Seven suffered even greater declines. In other words, investors who took comfort in the strong finish to 2021 were in for a rather unpleasant surprise.
In my view, extreme valuations played a major role, as did accelerating inflation and the interest rate hikes that belatedly followed.
Which brings me to today.
As I reflect upon it, 2026 has some similarities with 2021. But there is also an important difference. In 2021, investors were paying very high prices for businesses whose fundamental economics were relatively well understood. Today, valuations are more compelling, but the fundamental economics of those businesses may be becoming harder to understand.
And that, to me, is a more troubling problem.
Echoes of 2021?
Three things marked the period leading into the 2022 sell-off: Aggressive inflation, a Fed playing catch-up, and a tech trade ready to tumble.
Each of those variables is in question today, though none in quite the same manner.
Take inflation. In 2021, it was surging. In 2021, the Consumer Price Index averaged a 4.7% year-over-year climb each month. Today’s inflation is more modest — the latest data we have is September, which clocked in at 3.7% — but still frustratingly high, particularly considering we are rolling into year six of above-normal inflation levels.
But there’s a difference between inflation that is stubbornly high and inflation that is accelerating rapidly. And that difference matters for monetary policy.
In late 2021, the Fed was preparing to tighten monetary policy to get inflation under control. The rate hikes that followed in 2022 were remarkable, particularly for an economy and its markets that had grown complacent with rock-bottom yields.
I believe we sit at the beginning of another hiking cycle today, but this one is unlikely to reach the same heights. A more moderate, gradual cycle is less likely to spook markets. That said, rates are high across the curve, with structural forces (government spending, hyperscaler debt) that may keep the longer end of the curve higher regardless of what the Fed does.
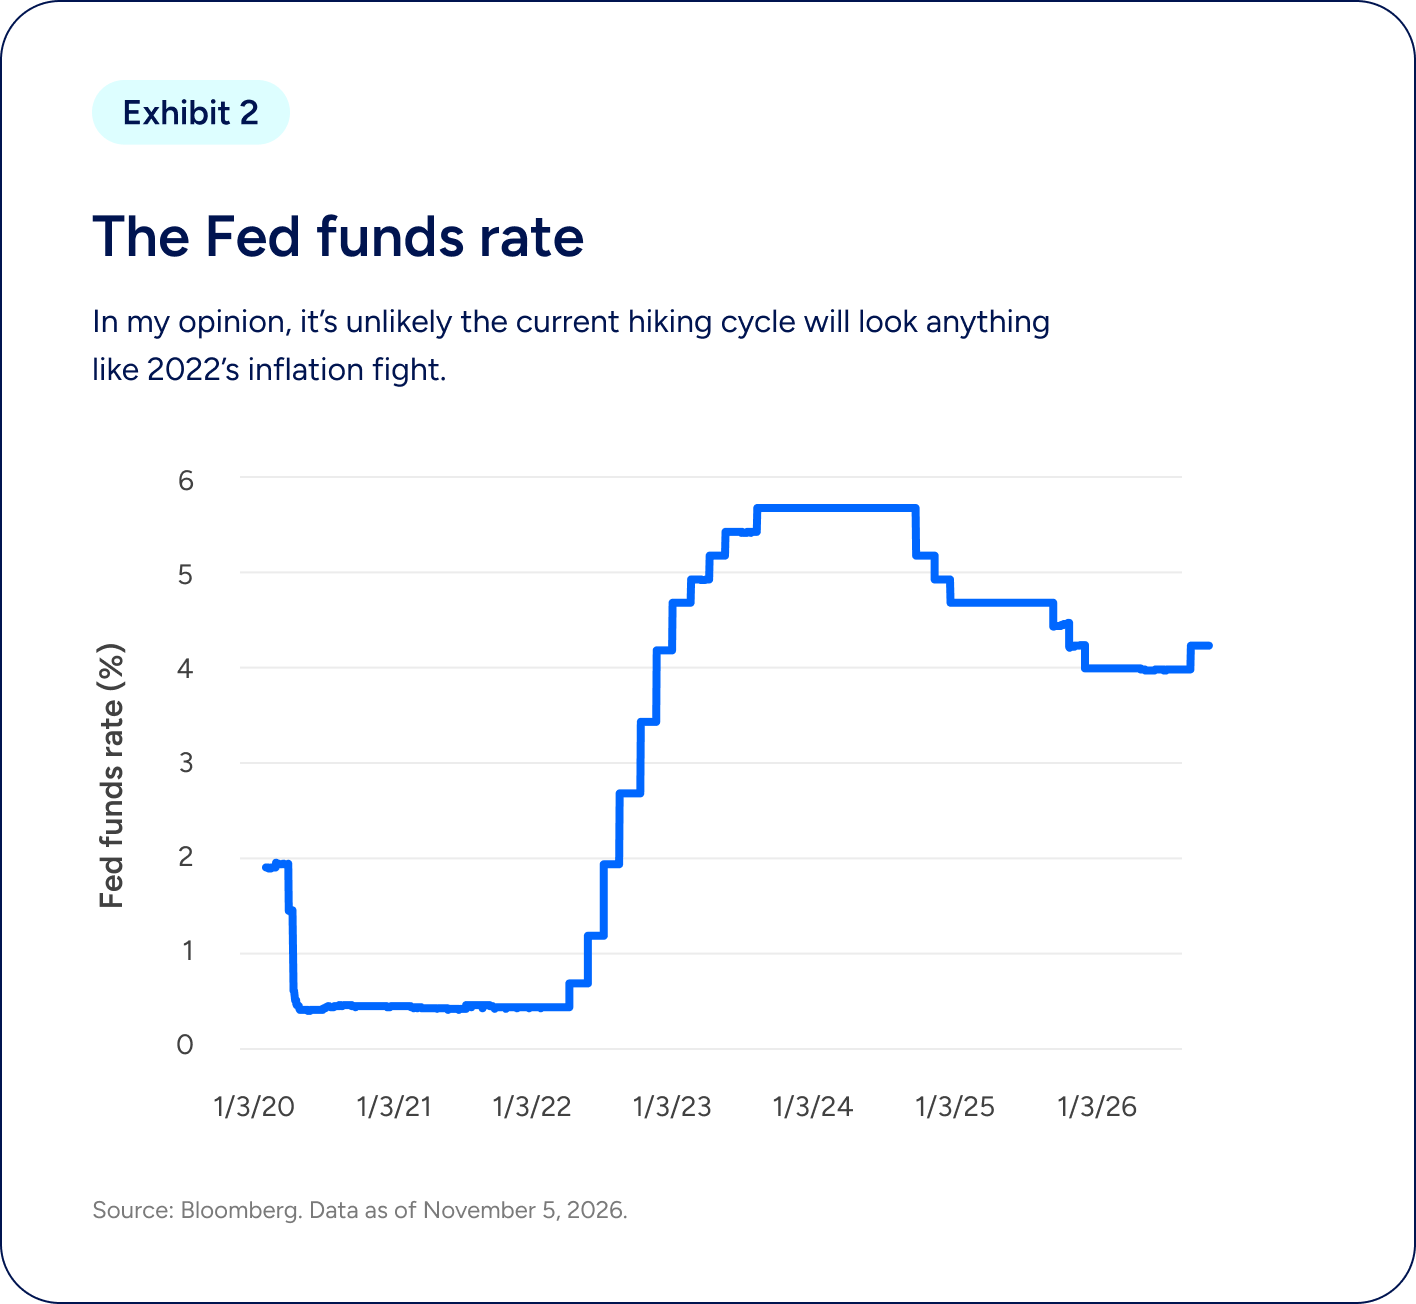
The chart tracks the federal funds rate from January 2020 through November 2026, illustrating the Federal Reserve's interest-rate changes over the period.
At the beginning of 2020, the federal funds rate was approximately 1.9% before falling sharply to around 0.4% during the early months of the COVID-19 pandemic. It remained near that level through early 2022.
Beginning in 2022, the rate increased rapidly as the Federal Reserve tightened monetary policy. By early 2023, it had risen above 4%, eventually reaching approximately 5.7% in late 2023. The rate remained near that peak through much of 2024.
Beginning in late 2024, the rate declined in several steps, falling to approximately 4.7% in early 2025 and around 4% by early 2026.
More recently, the rate increased modestly, reaching approximately 4.25% by November 2026.
Key takeaway: The federal funds rate has moved through several distinct phases since 2020: pandemic-era rate reductions, aggressive tightening beginning in 2022, subsequent easing, and a modest renewed increase in 2026. The recent increase is substantially smaller than the rapid rate hikes experienced during the 2022–2023 inflation-fighting cycle.
Source: Bloomberg. Data as of November 5, 2026.
So, some echoes of 2021, but a macroeconomic backdrop that isn’t quite as dicey.
Which brings us to tech. And here, I’m less reassured.
The tech trade: A different kind of risk
By November 1, 2021, the Bloomberg Magnificent Seven Index had returned 269% from the market low on March 23, 2020. And while the earnings trajectory looked compelling, the forward price to earnings was in the 10th decile of its own history; in other words, quite expensive.
After peaking on January 3, 2022, the Bloomberg Magnificent Seven Index fell 49%, marking an unusually painful collapse for the U.S.’s most prominent companies. And of course, putting it in a position to begin a remarkable rally, climbing 409%, peaking on October 13, 2026.
At first glance, today’s tech trade looks less vulnerable. The Bloomberg Magnificent Seven Index sits only in the lowest decile of its own valuation history. By comparison to 2021, that’s downright reassuring.
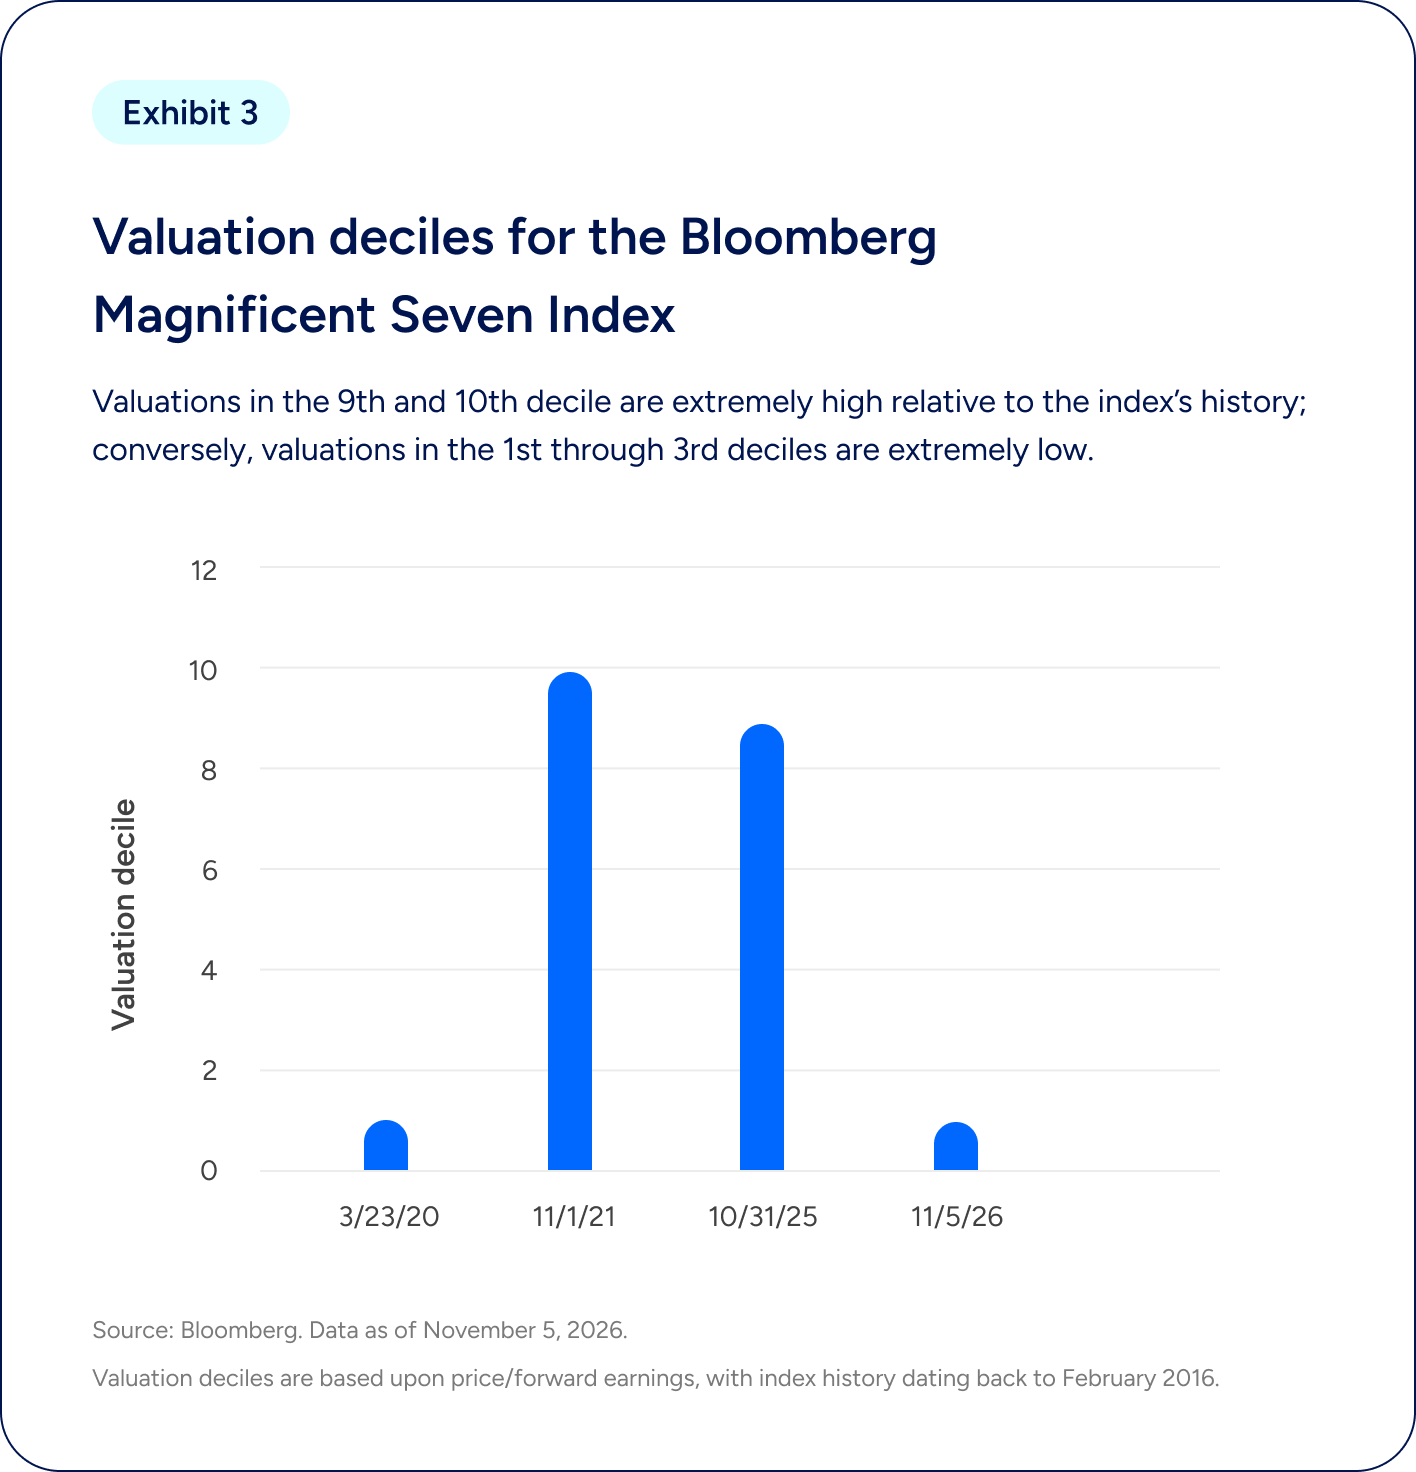
The chart compares the Bloomberg Magnificent Seven Index's valuation deciles at four dates, using price-to-forward-earnings ratios relative to the index's historical valuations dating back to February 2016.
On March 23, 2020, the index was in approximately the 1st valuation decile, indicating valuations near the lowest 10% of its historical range.
On November 1, 2021, valuations rose to approximately the 10th decile, placing them among the highest levels in the index's history.
On October 31, 2025, valuations were approximately in the 9th decile, again indicating historically elevated valuations.
By November 5, 2026, the index had returned to approximately the 1st valuation decile, indicating valuations near the lower end of its historical range.
Key takeaway: The Bloomberg Magnificent Seven Index has experienced substantial changes in relative valuation. After reaching historically elevated levels in 2021 and 2025, its valuation ranking declined sharply by November 2026, returning to levels comparable with those observed in March 2020.
Source: Bloomberg. Data as of November 5, 2026.
But I’m not sure the comparison is as reassuring as it seems.
The Magnificent Seven isn’t simply a collection of asset-light, high-cash flow, extremely profitable businesses anymore, but an amorphous group of businesses transitioning to an AI world. They remain highly profitable, with some encouraging signs around their ability to grow AI revenue, but they’re spending like wild to do it, and investors are leery of the potential return on investment (or lack thereof).
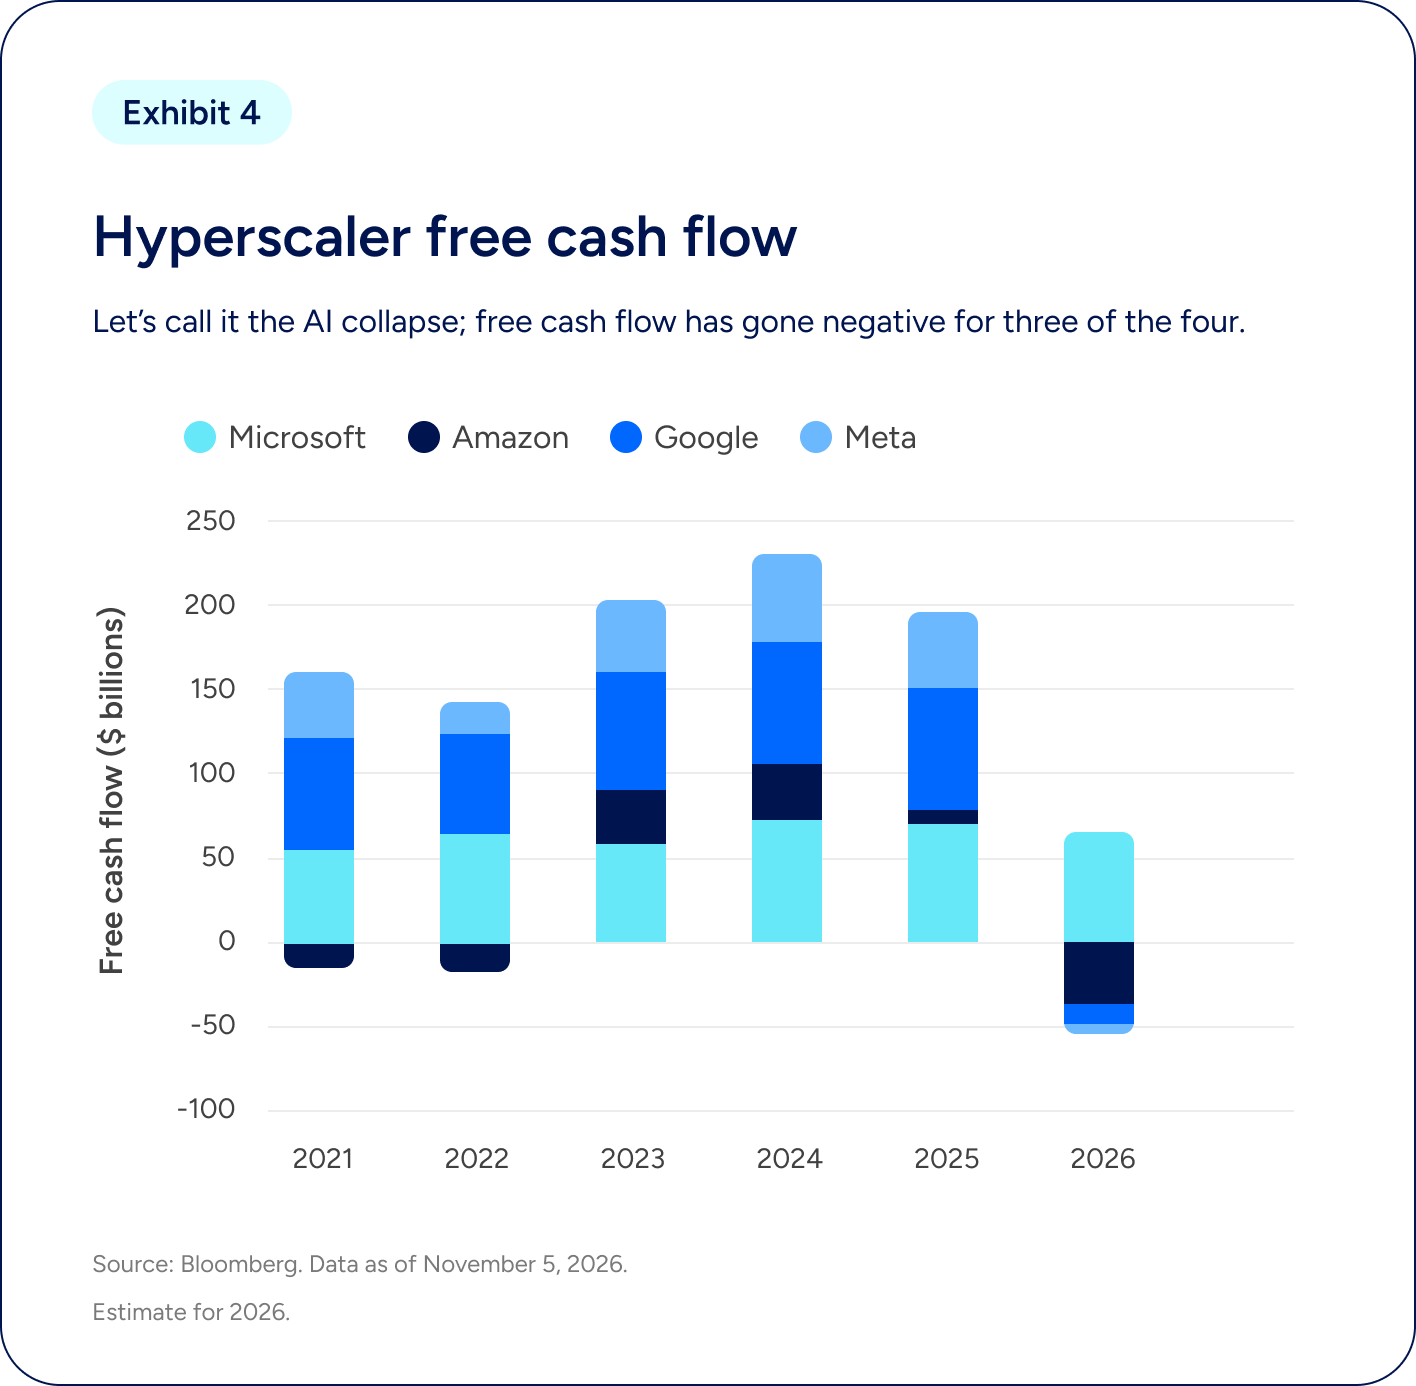
The chart compares annual free cash flow, measured in billions of dollars, for Microsoft, Amazon, Google, and Meta from 2021 through 2026. Figures for 2026 are estimates.
From 2021 through 2025, the companies generally generated substantial positive free cash flow, although Amazon recorded negative free cash flow in 2021 and 2022.
Combined positive free cash flow increased from approximately $160 billion in 2021 to a peak of roughly $230 billion in 2024, before declining to approximately $195 billion in 2025.
The outlook changes significantly in 2026. Microsoft is projected to remain positive at approximately $65 billion, while Amazon is projected to have negative free cash flow of roughly $37 billion, Google approximately negative $18 billion, and Meta approximately negative $7 billion.
Key takeaway: After several years of substantial free cash flow generation, three of the four hyperscalers are projected to experience negative free cash flow in 2026. The exhibit presents this shift in the context of significant AI-related investment, highlighting the potential financial pressures associated with expanding AI infrastructure.
Source: Bloomberg. Data as of November 5, 2026. The 2026 figures are estimates.
AI may well prove to be a transformational technology, but the capital required to build it out is enormous — and it isn’t yet clear whether the returns on that capital will justify the spending, or what will happen to legacy businesses, like Alphabet’s search business, that are less relevant in an AI world.
If businesses that historically generated extraordinary amounts of free cash flow now need to reinvest substantially more of their earnings to maintain their competitive positions, their fundamental economics may be changing.
We could also go half full here, since the opposite is also possible. AI could open enormous new revenue streams, and these companies could emerge as even more formidable compounders than they were before. The problem is that we don’t yet know which outcome we’re heading toward, or how much capital it will take to get there.
Which brings us back to valuations.
In 2021, investors were paying very high prices for businesses whose extraordinary economics were relatively well understood. Today, those prices look more reasonable. But the economics themselves may be becoming harder to understand.
And that’s an important distinction.
High valuations are, in part, a sentiment thing. If the fair value is stable, prices can move ahead or behind, and investors could use those price movements to help manage risk. But if the fair values themselves are in question, then we can’t be sure whether we’re looking at value or excess.
And today, the range of possible fair values may be unusually wide. These businesses could emerge from the AI buildout with extraordinary new earnings streams, or they could find themselves spending substantially more capital to generate the same returns. Both outcomes seem plausible. And that makes a stock’s historical valuation a less reliable guide to what it’s worth today.
None of this is to dismiss the hyperscalers. These remain extraordinary businesses, and even if we lower our estimates of their fair values to reflect greater capital intensity and uncertainty around returns, there may still be a discount in their share prices.
But the exercise of determining that discount has become considerably more complicated.
Of course, that question refers to a longer term than just these next two months. Which brings me back to where I started.
Frankly, predicting two months of returns is a heads-or-tails call. Probably we could lean toward higher; there have been more up days than down days, right? Seasonality is on our side, and the market has a remarkable capacity to look past longer-term concerns when earnings and sentiment remain supportive. Plus, we’ve seen some rotten market losses lately, which could embolden the #BuyTheDip crowd. (No judgment!)
Still. The experience of 2021 is a useful reminder that a strong finish to the year tells us very little about the risks that may be building beneath the surface.
And because everything worth saying is worth saying twice: The risks are large. Sell-offs based on valuation are one of my favorite kinds of sell-offs; they correct a misconception in markets and sometimes open the door for investors to get exposure at better prices. Sell-offs rooted in real concerns about fair value, however, are trickier; they require patience. And an appreciation for probabilities.
What I’m watching
Well, Anthropic, of course. I wrote about views around its valuation (maybe a touch high in my opinion) and impact on market structure (huge) back in the September edition. Looks like we are looking at an IPO before Thanksgiving, regardless of recent volatility.
Of course, I’m watching the AI trade broadly; the beatings it has taken recently all point to this concern I have around fair value — and whether the hyperscalers slow their spend, which hurts the broader AI supply chain. We’ll have to see what impact Nvidia’s numbers have on all of this; it reports on the 17th. On that note, the espionage angle looms large at the chipmaker; like everyone else, I'll be watching to see how that plays out.
And, of course, all things Iran, inflation, and rates. The more things change, the more they stay the same.
Our mission is to empower financial freedom for all Empower is a customer-obsessed financial services company delivering investment, wealth management, and retirement services to more than 20M people.1 The following tenets guide the development and management of products and solutions we provide to the investors we serve: Commit to an unwavering duty of care Our investors are our priority. We steward every dollar we invest with care, attention, and respect. Emphasize fundamental analysis We keep our eyes on the horizon by rooting our analysis in the underlying drivers of long-term investment returns, not fleeting news and noise. Plan for better outcomes through thoughtful diversification We build resilient portfolios by relying on thoughtful diversification that plans for a range of outcomes, rather than a narrow result. |
Explore previous editions
Stay up-to-date |
1 As of June 31, 2026
Opinions and data as of November 9, 2026.
Investing involves risk, including possible loss of principal.
Past performance, historical valuation levels, and seasonal market trends do not guarantee or predict future results.
This material is for informational purposes only and is not intended as individualized investment, legal, tax, or accounting advice or as a recommendation to buy, sell, or hold any security.
The opinions expressed reflect Empower’s views as of publication and are subject to change without notice. References to specific companies, securities, sectors, or indices are illustrative and do not constitute endorsements or investment recommendations.
Forward-looking statements, including market expectations, valuations, and economic projections, involve risks and uncertainties. Actual results may differ materially.
The S&P 500 Index is a registered trademark of Standard & Poor’s Financial Services LLC. It is an unmanaged index considered indicative of the domestic large-cap equity market and is used as a proxy for the stock market in general. Bloomberg® and the referenced indices are trademarks or service marks of Bloomberg Finance L.P. and its affiliates.
Bloomberg and any third-party providers are not affiliated with Empower and do not approve, endorse, review, or recommend the financial products referenced. Bloomberg does not guarantee the timeliness, accuracy, or completeness of any data related to the indices or financial products.
All trademarks are owned by their respective owners and no endorsement or affiliation is implied. All content is used for illustrative purposes only.
Information has been obtained from sources believed reliable, but its accuracy, adequacy, and completeness are not guaranteed.
Technology and AI-related investments may involve heightened volatility, valuation uncertainty, capital expenditure risk, and company-specific risks.
Historical valuation comparisons, including forward price-to-earnings ratios and valuation deciles, may not reflect current or future fair value.
Indices are unmanaged and cannot be invested in directly. Index returns do not reflect investment management fees, expenses, or taxes.
Securities, when presented, are offered and/or distributed by Empower Financial Services, Inc., Member FINRA/SIPC. EFSI is an affiliate of Empower Retirement, LLC; Empower Funds, Inc.; and registered investment adviser Empower Advisory Group, LLC. This material is for informational purposes only and is not intended to provide investment, legal, or tax recommendations or advice.
“EMPOWER” and all associated logos and product names are trademarks of Empower Annuity Insurance Company of America.
©2026 Empower Annuity Insurance Company of America. All rights reserved.
NV-WMLPNV-WF-7347900-1126 RO6096101-1126