
What is the average asset allocation by age?
What is the average asset allocation by age?
See how your asset allocation stacks up against the average investor’s portfolio – from stocks and bonds to cash and alternative assets.
What is the average asset allocation by age?
See how your asset allocation stacks up against the average investor’s portfolio – from stocks and bonds to cash and alternative assets.

04.15.2026
Key takeaways
- Cash is king for investors in their 20s – the cohort holds more assets in cash (38.7%) than any other age group, except retirees aged 80 or older
- Investors in their 20s, 30s, and 40s have about 37-41% allocation of U.S. stocks (vs 8% for international stocks)
- Investors in their 20s, 30s, and 40s all have a bond allocation of 5% or less
A person’s financial portfolio changes over time alongside income, expenses and retirement horizon.
Take a look at what Empower Personal DashboardTM data reveals about how asset allocation changes as Americans age. *
Portfolio size and allocation by age
It’s not surprising that as investors age, the size of their portfolio grows, on average, until they reach retirement age. Empower data shows that the average dashboard users’ net worth peaks in their 60s at an average of $1,577,907 and starts to decline in their 70s as they reach retirement.
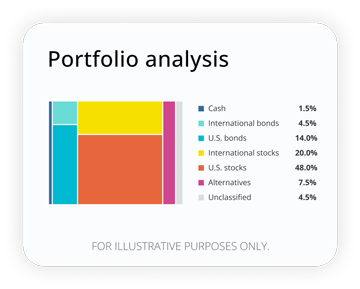
But how do Americans allocate their assets at different stages in their lifetime? Analysis of Empower Personal DashboardTM data reveals that the age-old saying rings true for many Americans: “Don’t put all your eggs in one basket.” Personal Dashboard users allocate their assets across cash, stocks, bonds, and alternative investments — but how those assets are allocated varies between age groups.
How well are your investments performing?
Analyze your portfolio in minutes and receive a target allocation for your goals.
Average cash holdings by age
According to Empower data, younger investors in their 20s place a higher percentage of their assets in cash (38.7%) than any other age group except retirees in their 80s (40.5%) and 90s (45.7%). The median cash balance in the portfolios of those in their 20s is $22,130, while investors in their 30s keep an average of $44,307 (28%) in cash.
Empower research shows that 52% of Americans say “cash is king” and nearly a third carry it with them every day (27%). This large cash holding may be due to younger investors’ relative inexperience and potential risk aversion. However, by keeping so much of their financial assets in low-yielding cash instruments like savings and money market accounts, young investors may be missing opportunities to take advantage of long-term compounding to help grow their portfolios.
Read more: How much should I have saved by 30? Get a Sense Check
Average stock allocations by age
Young and middle-aged investors keep a relatively high percentage of their portfolio assets in stocks.
Investors in their 20s, 30s and 40s all maintain about a 37-41% allocation of U.S. stocks and 8% allocation of international stocks in their financial portfolios.
Age | Median U.S. stocks | Median international stocks |
20s | $46,262 | $4,034 |
30s | $155,164 | $21,416 |
40s | $261,578 | $41,587 |
Investors in their 50s keep 38% in U.S. stocks and 9% in international stocks. Those in their 60s keep 35% and 8.7%, respectively.
Age | Median U.S. stocks | Median international stocks |
50s | $367,412 | $67,253 |
60s | $330,022 | $65,044 |
Older investors in their 70s and over keep between 30% and 32% of their portfolio assets in U.S. stocks and between 4% and 7% in international stocks.
Age | Median U.S. stocks | Median international stocks |
70s | $216,536 | $34,201 |
80s | $170,244 | $19,527 |
90s | $111,536 | $7,118 |
Generally speaking, your age determines how much risk you’re willing to take on your investments. As you near retirement age, you may want to cut back on the amount of risk in your portfolio as you don’t have time to lose and replenish the capital base in your nest egg. Empower research reveals that 49% of Americans are taking the long-view approach to the stock market, and 58% say they need trusted financial counsel now more than ever.
Read more: What is portfolio management?
Bond and alternative asset allocations by age
Younger investors hold a much lower percentage of their portfolio assets in bonds than middle-aged and older investors. Those in their 20s, 30s and 40s all have a bond allocation (both domestic and international) of less than 5%.
While investors in their 50s have a total bond allocation (domestic and international) of 9%, the total bond allocation of investors in their 60s is 13%.
For older investors, bond allocations are as follows:
Age | U.S. bonds | International bonds |
70s | 10.91% | 1.87% |
80s | 10.53% | 1.74% |
90s | 8.89% | 1.14% |
Meanwhile, the average allocations and median amounts of alternative assets in financial portfolios according to age are as follows:
Age | Median allocation of alternatives | Percentage of alternatives in overall portfolio |
20s | $1,153.92 | 1.83% |
30s | $4,688.15 | 2.27% |
40s | $9,130.65 | 2.61% |
50s | $15,346.01 | 3.05% |
60s | $17,320.80 | 3.43% |
70s | $9,988.67 | 3.04% |
80s | $5,954.04 | 2.88% |
90s | $2,708.65 | 1.73% |
Key considerations for asset allocation
Whether you’re an experienced investor or just getting started, having the right mix of investments can help you handle the ups and downs of the market while working towards your financial goals. When allocating capital, consider:
- Timeline: When do you plan to use the money in your portfolio?
- Goals: What’s your objective when it comes to investing – buying your first home? Your child’s education? Retirement?
- Risk tolerance: Are you able to endure fluctuations in the value of your investments?
Considering these things can help you decide how aggressive you plan to be as an investor. In turn, this can influence the way you allocate your portfolio among stocks, bonds, cash, and other investments.
Tips for improving your portfolio mix
Establish a diverse portfolio
An important aspect of creating a financial portfolio that helps generate sustainable long-term returns is choosing the right asset allocation based on your investing goals, time frame and risk tolerance. Your portfolio should be well-diversified, with the appropriate mix of assets across the main asset classes of stocks, bonds, cash alternatives and alternative investments.
Rebalance your portfolio when necessary
It’s also important to review your financial portfolio periodically and rebalance when needed. Over time, market movements can shift your asset allocation, so it is no longer in line with your objectives.
For example, when stock prices rise, stocks might make up a higher percentage of your portfolio than you intend. To bring your portfolio back into balance, you could sell some of your stock positions and use the proceeds to purchase assets in other classes, such as cash alternatives and bonds.
Monitor portfolio performance
It's important to regularly monitor the performance of your portfolio holdings. Be sure to assess your risk tolerance, consider your target asset allocation based on that risk level and retirement horizon, and compare your current portfolio to your target. This helps ensure you’re staying on track with the portfolio that meets your needs.
Resist the urge to “time” the market
When markets get rocky, it's tempting to take action. But that may only disrupt your long-term goals. Even when markets are down and one investment is performing poorly, another could be performing better. Resist the urge to try to "time" the market by readjusting your portfolio based on market conditions alone — and consider asking a professional for help if you think you're having trouble being objective.
Work with a financial professional
More than half (52%) of Americans know their financial goals, but don’t know how to get there, according to Empower data. If you’re unsure how to choose a portfolio management strategy that will help you achieve your short-term and long-term financial goals, working with a financial professional may be a helpful step. Seeking out professional guidance can result in a strategy that’s more efficiently tailored to your individual circumstances, risk tolerance, and goals.
Read more: Essential steps for retirement planning
The bottom line
No simple formula can find the right asset allocation for every individual investor, but basing your asset allocation on age can be a useful tool for helping to reach your short and long-term goals.
Investing involves risk, including possible loss of principal.
Asset allocation, diversification, and/or rebalancing do not ensure a profit or protect against loss.
*Anonymized user data from the Empower Personal Dashboard™ as of March 31, 2026. Major asset classes are included; percentages may not total 100.
This data analysis only includes a subset of our free tools users. Following is the list of exclusions: limited to users that logged in in the past year; excludes accounts that are deleted, test, or invalid/bogus; also excludes those who are trading on margin (i.e. borrowing money to invest, leaving them with a “negative” cash holding); and excludes outliers with asset values greater than 10M in any asset category (e.g. cash, bonds).
RO3769660-0824


The Currency editors
Staff contributors
The CurrencyTM writers and editors cover the latest financial news and insights shaping how we live, work, and play. The team provides accurate, data-driven, and timely content aimed at empowering financial freedom for all.
The content contained in this blog post is intended for general informational purposes only and is not meant to constitute legal, tax, accounting or investment advice. You should consult a qualified legal or tax professional regarding your specific situation. No part of this blog, nor the links contained therein is a solicitation or offer to sell securities. Compensation for freelance contributions not to exceed $1,250. Third-party data is obtained from sources believed to be reliable; however, Empower cannot guarantee the accuracy, timeliness, completeness or fitness of this data for any particular purpose. Third-party links are provided solely as a convenience and do not imply an affiliation, endorsement or approval by Empower of the contents on such third-party websites. This article is based on current events, research, and developments at the time of publication, which may change over time.
Certain sections of this blog may contain forward-looking statements that are based on our reasonable expectations, estimates, projections and assumptions. Past performance is not a guarantee of future return, nor is it indicative of future performance. Investing involves risk. The value of your investment will fluctuate and you may lose money.
Certified Financial Planner Board of Standards Inc. (CFP Board) owns the certification marks CFP®, CERTIFIED FINANCIAL PLANNER™, CFP® (with plaque design), and CFP® (with flame design) in the U.S., which it authorizes use of by individuals who successfully complete CFP Board's initial and ongoing certification requirements.