
The Currency


 Be current.
Get insights and intel on your money.
*If you’re already registered with Empower, please use the same email address as your existing account.


According to Empower research, more than a quarter of mortgage holders have a mortgage rate between 3% and 3.99%, and the housing market has taken on new dynamics:
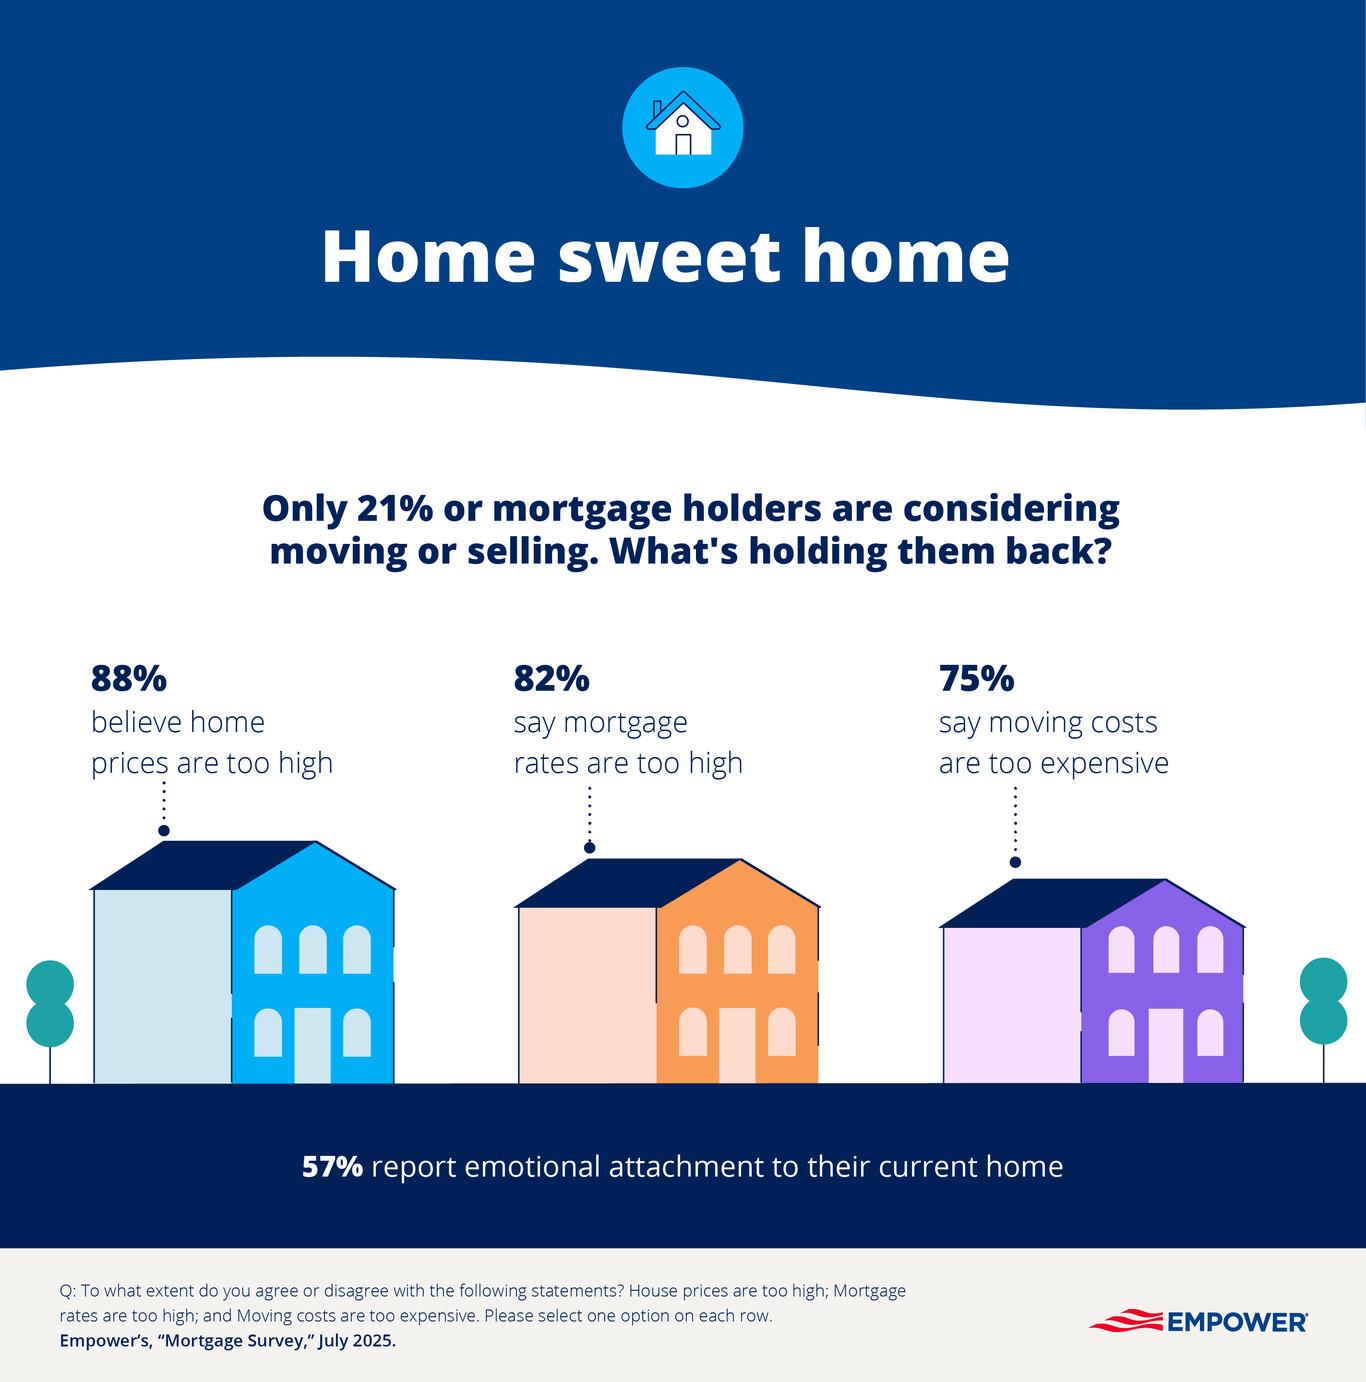
According to Empower research, more than a quarter of mortgage holders have a mortgage rate between 3% and 3.99%, and the housing market has taken on new dynamics:
Explore by topic


What is a Health Reimbursement Arrangement (HRA)?
Life
Theme Slug
category--life
Pathauto Slug
life
A health reimbursement arrangement (HRA) is an employer-funded benefit that reimburses eligible medical costs while offering potential tax savings
🛤️ Stay on track
Money
Theme Slug
category--money
Pathauto Slug
money
Nearly half (47%) of Americans wish for a “do-over” on savings, making every opportunity to maximize returns count. Here's this month's money news.
Becoming the 401(k) millionaire next door
Life
Theme Slug
category--life
Pathauto Slug
life
The amount of retirement millionaires continues to grow, according to Empower data, with 21.9% of Americans falling into this category of retirement savers.