


Q4 bonds overview 2026

U.S. economic and market outlook 2026
Q4 outlook overview: Bonds
U.S. economic and market outlook 2026
Q4 outlook overview: Bonds
June 2026
We expected the Fed to hold rates steady and remained unimpressed with the limited compensation investors got for taking on credit risk.
We saw tight credit spreads as a warning to avoid excessive risk taking. Meanwhile, we didn’t expect a rate hike during the third quarter. We thought the current sources of inflation weren’t entirely sensitive to higher rates from the Federal Reserve and expected a continued pause. On the whole, we considered that bonds could still be a reasonable choice for investors, with higher yields compensating investors for rate and inflation risk.
Since then
The Treasury curve has shifted higher. Again.
As was the case in Q2, credit held the line in Q3. The real action was the U.S. yield curve, which climbed across maturities but with the largest moves at the short end.
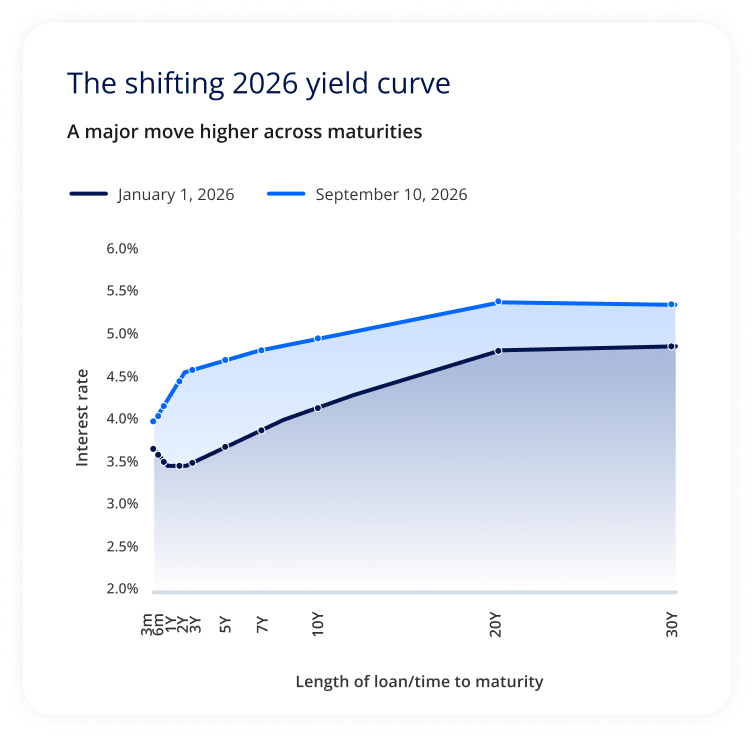
The chart compares U.S. Treasury interest rates across maturities from 3 months to 30 years on January 1, 2026, and September 10, 2026.
On January 1, short-term yields begin around 3.6%, decline to roughly 3.4%–3.5% around the 1- to 2-year maturities, and then rise with longer maturities. The yield reaches approximately 4.1% at 10 years, 4.8% at 20 years, and 4.9% at 30 years.
By September 10, the entire yield curve has shifted higher. Short-term yields are approximately 4.0%, rising quickly to about 4.5%–4.6% around 1 to 2 years. Yields continue increasing to roughly 4.9% at 10 years and 5.4% at 20 and 30 years.
Key takeaway: Treasury yields moved substantially higher across the maturity spectrum during 2026. The increase was especially pronounced at shorter and intermediate maturities, while long-term yields also rose by roughly half a percentage point.
This was a surprise to us. While we didn’t necessarily anticipate a lower yield curve, we didn’t expect a shift higher. And despite inflation concerns, it’s been other variables, including debt issuance by Big Tech, concerns about the U.S. fiscal position, and changing relationships with sovereign debt markets outside the U.S. that have acted as the primary catalysts for higher yields.
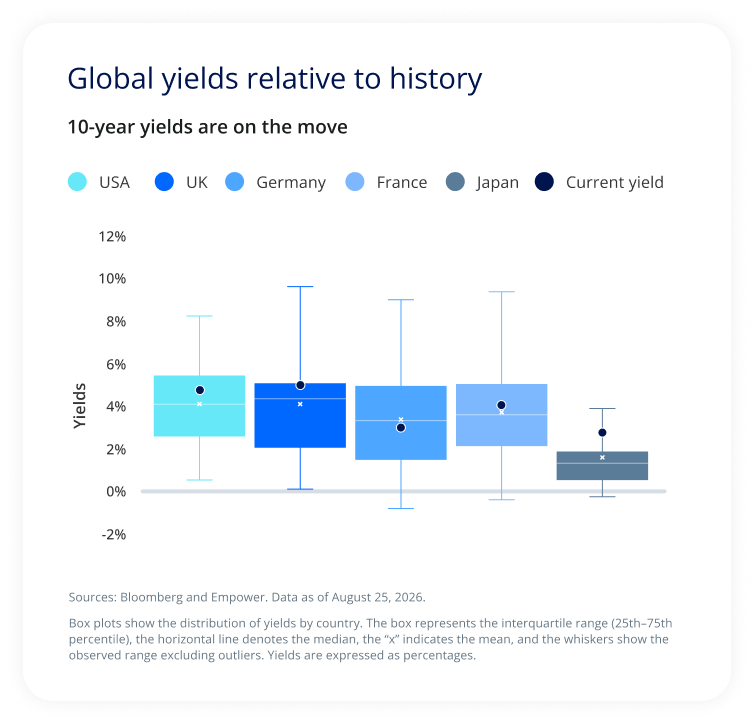
The chart compares current 10-year government bond yields with their historical distributions in the United States, United Kingdom, Germany, France, and Japan. Each box represents the middle 50% of historical yields, the horizontal line marks the median, the "x" represents the mean, and the whiskers show the observed range excluding outliers.
Current yields are approximately 4.8% in the U.S., 5.0% in the U.K., 3.0% in Germany, 4.1% in France, and 2.8% in Japan.
In all five countries, the current yield is above the historical mean shown in the chart. Current U.S. and U.K. yields are toward the upper portion of their historical distributions. France's current yield is also above its historical median and mean. Germany's current yield is closer to the center of its historical distribution, while Japan's current yield stands well above its historical median and mean, though still within its historical range.
Key takeaway: Current 10-year government bond yields are elevated relative to historical averages across all five countries shown, although their positions within each country's historical range differ.
Source: Bloomberg and Empower. Data as of August 25, 2026.
September 2026
We don’t expect quick resolution to yield-curve concerns.
The Treasury Department is actively trying to shift yields lower at the longer end of the curve. Perhaps that will prove effective in time. Moreover, a credibly hawkish stance by the Fed could counterintuitively bring down the longer end of the curve if it gives investors enduring confidence that the Fed will take the fight to inflation. Overall, however, the large structural questions surrounding the yield curve — hyperscaler debt issuance in particular — seem likely to continue. Thus, we think incorporating the potential for higher yields is a reasonable starting point for fixed-income investors when assessing the current market environment and associated risks.
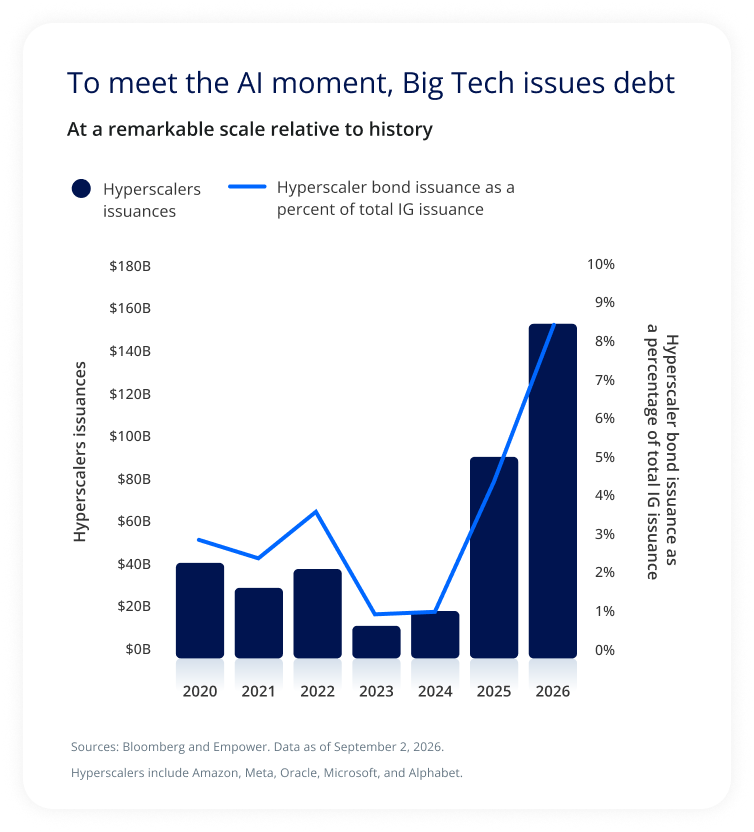
The chart tracks annual bond issuance by hyperscalers from 2020 through 2026 and shows that issuance as a percentage of total investment-grade bond issuance.
Hyperscaler bond issuance was approximately $40 billion in 2020, $30 billion in 2021, and nearly $40 billion in 2022. It then declined to roughly $10 billion in 2023 and remained below $20 billion in 2024.
Issuance increased sharply thereafter, reaching approximately $90 billion in 2025 and about $150 billion in 2026.
Hyperscalers' share of total investment-grade bond issuance followed a similar pattern. It was approximately 3% in 2020, declined to around 2%–2.5% in 2021, rose above 3% in 2022, and fell to roughly 1% in 2023 and 2024. The share then increased to approximately 4% in 2025 and more than 8% in 2026.
Key takeaway: Hyperscaler borrowing accelerated dramatically in 2025 and 2026, both in absolute dollars and as a share of the investment-grade bond market. The graphic presents this increase as Big Tech turning to debt markets at historically significant scale as companies invest in AI.
Hyperscalers include Amazon, Meta, Oracle, Microsoft, and Alphabet. Source: Bloomberg and Empower; data as of September 2, 2026.
The upside is a better starting point for investors, with higher yields providing greater income potential and compensation for taking interest-rate risk. Yield is the primary component of return for fixed income, so higher yields put investors in a much better position than they were a few years ago. With this in mind, we think fixed income can still have a place in investors’ portfolios, particularly given today’s higher starting yields.
On the credit side of things, we expect the status quo to linger: Tight spreads but strong corporate profitability. Investors won’t get much extra compensation for taking credit risk, but fundamentals appear healthy enough for that not to be a major concern.
Explore the Q4 outlook
Explore the Q4 outlook
Explore the Q4 outlook: Stay up-to-date |
The opinions expressed represent the current, good-faith views of Empower at the time of publication, are provided for limited purposes, and should not be relied upon as investment or legal advice.
Investing involves risk, including possible loss of principal.
Past performance, where discussed, is not a guarantee of future results. Historical trends and economic data discussed may not be indicative of future conditions which may change.
This material is for informational/educational purposes only; it may not be suitable for all investors; is not tailored to any specific investor’s objectives or financial situation; and is not intended as investment, legal, tax, or accounting advice.
This content is based on information available at the time and may change based on more current conditions. This is neither an endorsement of any security, index, sector, or investment, nor a solicitation to offer investment advice or sell products or services offered by Empower or its affiliates. It is impossible to invest directly in an index. References to asset classes or sectors are for illustrative purposes only and are not recommendations.
The information presented was developed internally and/or obtained from sources believed to be reliable; however, Empower does not guarantee the accuracy, adequacy, or completeness of such information.
Predictions, opinions, and other information contained in this communication are subject to change without notice and may no longer be true after the date indicated.
Commentary may contain forward-looking statements based on reasonable expectations, estimates, projections, and assumptions. Forward-looking statements are not guarantees of future performance and involve risks and uncertainties that are difficult to predict.
Fixed-income securities are subject to interest rate risk and inflation risk.
“EMPOWER” and all associated logos and product names are trademarks of Empower Annuity Insurance Company of America.
©2026 Empower Annuity Insurance Company of America. All rights reserved.
INV-WMLPNV-WF-7031510-0926 RO5923819-0926
Investment Insights