


Q4 stocks overview 2026
U.S. economic and market outlook 2026
Q4 outlook overview: Stocks
U.S. economic and market outlook 2026
Q4 outlook overview: Stocks
June 2026
We considered valuations for the broad U.S. equity market reasonable and thought the exceptional earnings trajectory remained intact. We did expect continued volatility from the AI trade, though.
The earnings generated by the memory bottleneck were exceptional and deservedly generated massive price performance for the first half of the year. But even as the stocks then sold off, we weren’t convinced they would stage a recovery. The gains earlier in the year had just been too exceptional; we wondered what good news hadn’t already been priced in.
We liked other areas of the AI trade a bit more; the hyperscalers in particular. These stocks ran into trouble toward the end of 2025 and never really reclaimed market leadership despite putting up impressive earnings. Questions lingered about their role in the AI build-out, particularly as their once-enviable cash flow disappeared and they turned to capital markets to maintain their spending. While we acknowledged those concerns, we felt valuations accounted for at least some of the risk.
More broadly, we thought earnings and valuations put the rest of the market in a position to grind higher and viewed defensive areas like healthcare as potentially more resilient in a difficult market environment.
Since then
Meh.
Thus far, an O.K. quarter. The Bloomberg 500 Index has moved higher since July 1, with the Bloomberg Magnificent 7 Total Return Index up modestly more, with a nearly 11% return. But the hero of the first half of the year, memory stocks, are still down nearly 5% since July 1. In fact, it’s been other areas (energy, for example) or software stocks — which we thought had been unfairly penalized by AI displacement fears earlier this year — that have had a strong third quarter.
This wasn’t an earnings issue. In fact, earnings have been strong across the board, particularly within the AI trade. But some AI fatigue seems to have entered the investor psyche, with real questions around the durability of spending shifting investor sentiment. Meanwhile, the ongoing conflict in Iran was arguably a macro support for the energy trade, and software benefited from low expectations.
September 2026
We have more modest expectations for the back half of the year.
We still see valuation opportunities in select areas — members of the Mag 7, for example, and select software stocks — but are less enthused about the broader AI trade, which seemed to borrow from future returns with its blowout performance earlier this year.
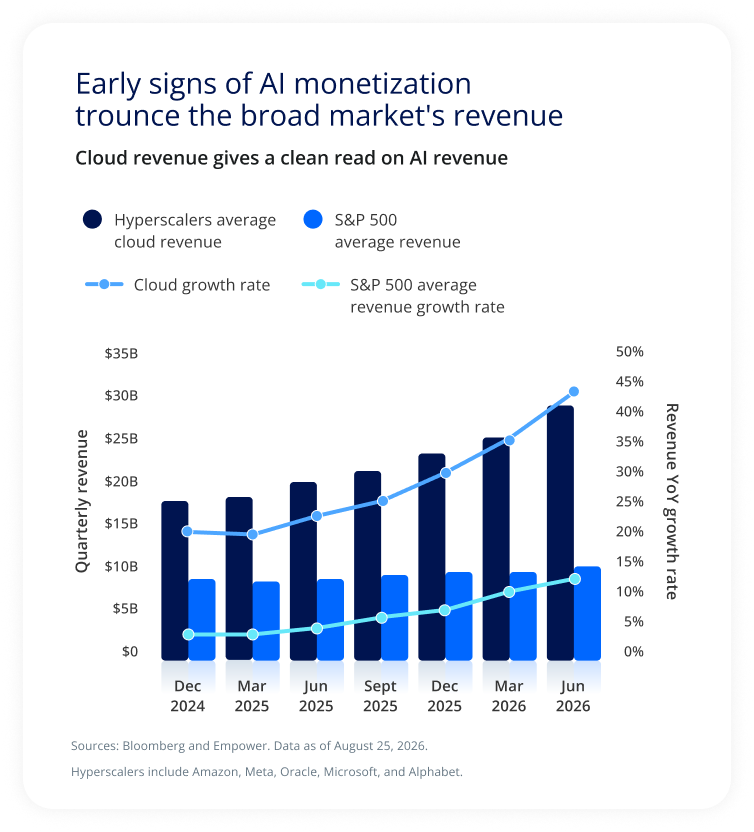
The chart compares quarterly average cloud revenue for hyperscalers with average S&P 500 company revenue from December 2024 through June 2026. It also compares the year-over-year growth rates of the two groups.
Average hyperscaler cloud revenue rises from roughly $18 billion in December 2024 to about $29 billion in June 2026. Over the same period, average S&P 500 revenue increases more gradually, from approximately $8.5 billion to nearly $10 billion.
The difference is more pronounced in growth rates. Hyperscaler cloud revenue growth begins near 20% year over year, dips slightly in early 2025, and then accelerates steadily to approximately 43% by June 2026. Average S&P 500 revenue growth increases more modestly, from roughly 3% to about 12%.
Key takeaway: Cloud revenue among major hyperscalers is accelerating considerably faster than revenue across the broader S&P 500, which the graphic presents as an early indication of AI monetization.
Hyperscalers in this analysis include Amazon, Meta, Oracle, Microsoft, and Alphabet. Source: Bloomberg and Empower; data as of August 25, 2026.
Other sectors of the market, like financials, consumer discretionary, materials, or communication services, actually boast attractive valuations. Some of that is a Big Tech effect, with companies like Meta, Alphabet, and Amazon embedded in sectors outside technology. But some of it relates to strong earnings performance alongside quieter stock-market reactions for the broader market.
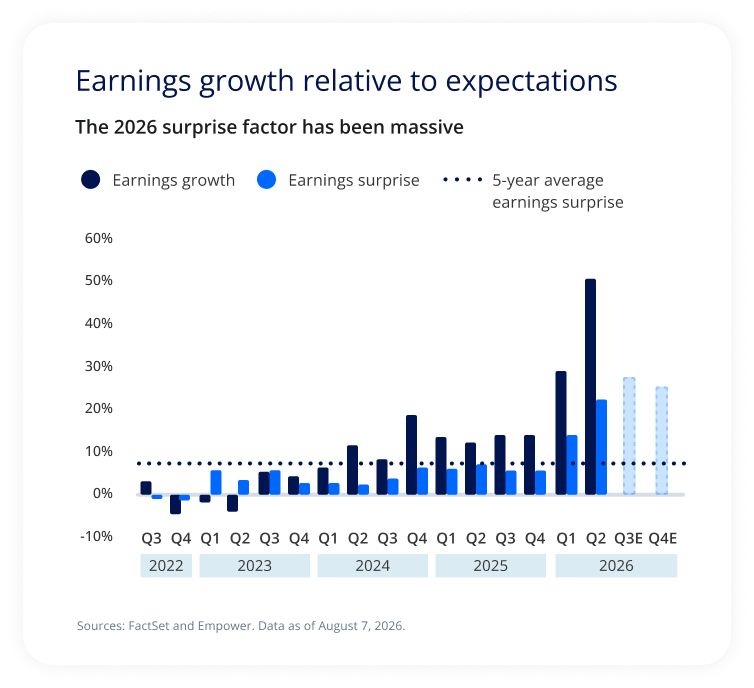
The chart compares quarterly earnings growth and earnings surprises from the third quarter of 2022 through the second quarter of 2026, with estimates shown for the third and fourth quarters of 2026. A dotted horizontal line represents the five-year average earnings surprise, at roughly 7%.
Earnings growth varies around zero during late 2022 and early 2023 before generally strengthening through 2024 and 2025. It accelerates significantly in 2026, rising to approximately 29% in Q1 and 50% in Q2.
Earnings surprises are generally below the five-year average during most of the period shown. In 2026, however, the surprise rises substantially, reaching roughly 14% in Q1 and 22% in Q2, well above the approximately 7% five-year average.
Estimates for Q3 and Q4 2026 indicate earnings surprises of approximately 27% and 25%, respectively.
Key takeaway: Earnings results have exceeded expectations by unusually large margins in 2026, with the earnings surprise substantially above its five-year average as earnings growth has also accelerated.
Source: FactSet and Empower. Data as of August 7, 2026.
We expect earnings strength to continue, at least near term. Combine that with better valuations outside the AI trade, and there may be some fundamental rationale for optimism for the broader U.S. equity market. That said, we’d note that earnings expectations are beginning to look a little aggressive in a few places. We consider higher yields an impediment, and compelling opportunities seem elusive, even as certain themes seem to have continued momentum (consider the energy space again, for example). We’d also caution that true diversification in the U.S. is hard to find; all roads seem to lead back to AI.
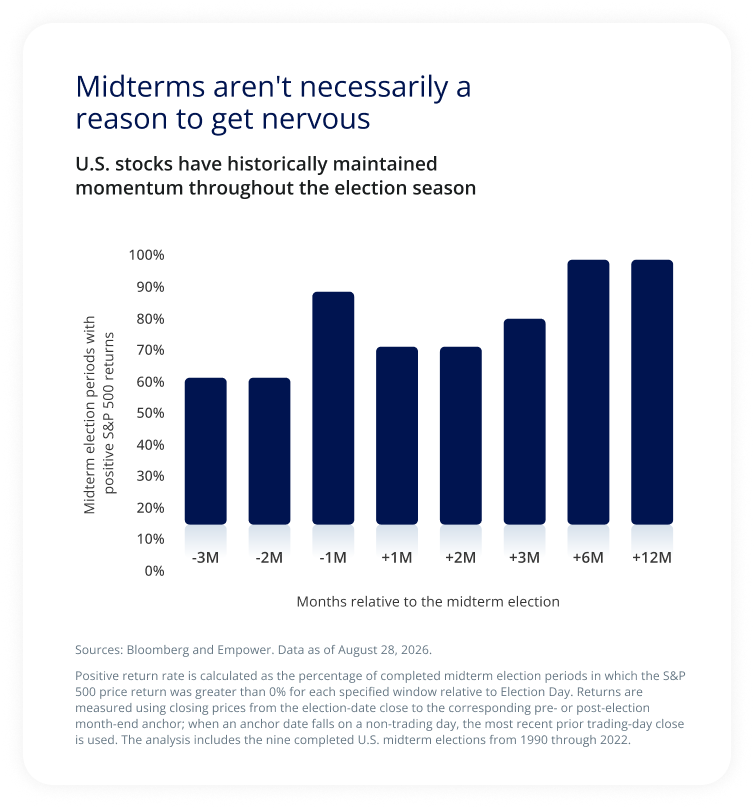
The chart shows the percentage of completed U.S. midterm election periods since 1990 in which the S&P 500 had positive returns at selected intervals before and after Election Day.
Positive returns occurred in approximately 60% of periods three months before the election, 60% two months before, and nearly 90% one month before.
After the election, approximately 70% of periods had positive returns at one and two months, rising to about 80% at three months. At both six and 12 months after the election, nearly 100% of the historical periods shown had positive S&P 500 returns.
Key takeaway: Across the nine completed U.S. midterm election periods from 1990 through 2022, positive S&P 500 returns were common both before and after Election Day and became more frequent over the longer post-election periods shown.
Source: Bloomberg and Empower. Data as of August 28, 2026.
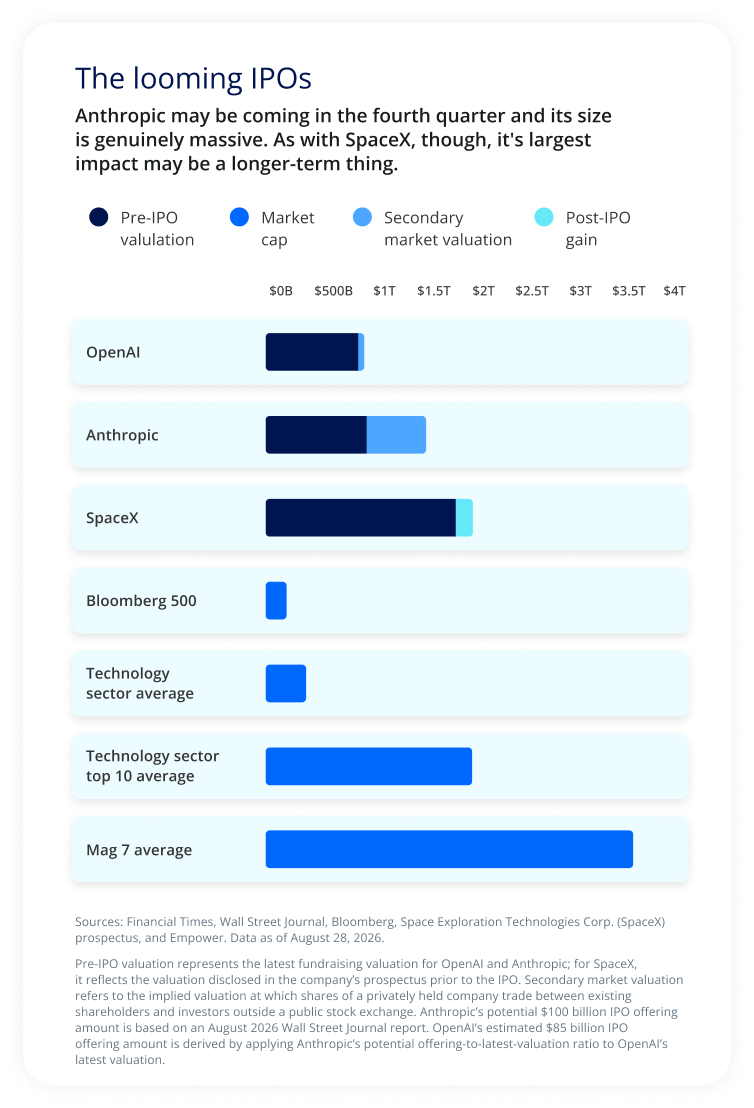
The chart compares private-company valuations for OpenAI, Anthropic, and SpaceX with market-cap benchmarks from the Bloomberg 500 and technology sector.
OpenAI's latest pre-IPO valuation is shown at roughly $1 trillion. Anthropic's pre-IPO valuation is also approximately $1 trillion, with its secondary-market valuation extending to roughly $1.5 trillion. SpaceX is shown at approximately $2 trillion, including a relatively small post-IPO gain.
For comparison, the Bloomberg 500 average market capitalization is roughly $200 billion, while the technology-sector average is approximately $400 billion. The average for the 10 largest technology companies is about $2 trillion, and the Magnificent 7 average is approximately $3.5 trillion.
The graphic notes that Anthropic may pursue an IPO in the fourth quarter. Its potential $100 billion IPO offering amount is based on an August 2026 Wall Street Journal report and is not an announced offering amount. OpenAI's estimated $85 billion offering amount is hypothetical and is derived by applying Anthropic's potential offering-to-latest-valuation ratio to OpenAI's latest valuation.
Key takeaway: The valuations shown for Anthropic and OpenAI are substantially larger than the average public company in the Bloomberg 500 or technology sector and approach the scale of the largest technology companies. The graphic presents Anthropic's potential IPO as unusually large while emphasizing that its offering amount has not been announced.
Explore the Q4 outlook
Explore the Q4 outlook
Explore the Q4 outlook: Stay up-to-date |
The opinions expressed represent the current, good-faith views of Empower at the time of publication, are provided for limited purposes, and should not be relied upon as investment or legal advice.
Investing involves risk, including possible loss of principal.
Past performance, where discussed, is not a guarantee of future results. Historical trends and economic data discussed may not be indicative of future conditions which may change.
This material is for informational/educational purposes only; it may not be suitable for all investors; is not tailored to any specific investor’s objectives or financial situation; and is not intended as investment, legal, tax, or accounting advice.
This content is based on information available at the time and may change based on more current conditions. This is neither an endorsement of any security, index, sector, or investment, nor a solicitation to offer investment advice or sell products or services offered by Empower or its affiliates. It is impossible to invest directly in an index. References to asset classes or sectors are for illustrative purposes only and are not recommendations.
The information presented was developed internally and/or obtained from sources believed to be reliable; however, Empower does not guarantee the accuracy, adequacy, or completeness of such information.
Predictions, opinions, and other information contained in this communication are subject to change without notice and may no longer be true after the date indicated.
Commentary may contain forward-looking statements based on reasonable expectations, estimates, projections, and assumptions. Forward-looking statements are not guarantees of future performance and involve risks and uncertainties that are difficult to predict.
Fixed-income securities are subject to interest rate risk and inflation risk.
“EMPOWER” and all associated logos and product names are trademarks of Empower Annuity Insurance Company of America.
©2026 Empower Annuity Insurance Company of America. All rights reserved.
INV-WMLPNV-WF-7031510-0926 RO5923819-0926
Investment Insights