


Q4 outlook overview 2026
U.S. economic and market outlook 2026
Q4 outlook overview: Economy
U.S. economic and market outlook 2026
Q4 outlook overview: Economy

Economy
June 2026
We expected AI to roll on but had a more nuanced view on the U.S. consumer.
We thought we were in the early innings of the AI build and implementation, making the massive spending a continued catalyst for the U.S. economy, with the impact felt not just within technology, but across the broader AI supply chain.
We had a more nuanced view of the U.S. consumer. Our concerns centered less on the durability of the labor market and more on a consumer that we thought would feel increasingly beleaguered under the weight of higher energy prices, weak real wage growth, and little housing market improvement.
Even with those headwinds, though, we expected continued resilience, not just because the labor market remained intact, but also because of the wealth effect: ongoing stock market gains combined with the housing gains of prior years.
Net-net, we saw AI carrying the economy, with the consumer begrudgingly along for the ride.
Since then
Resilience was indeed the name of the game this summer.
Concerns continued, particularly around negative real wage growth, modestly elevated delinquencies, and uneven spending. But the labor market held the line, with the supply and demand for jobs largely in equilibrium. Meanwhile, in the growing AI world, spending did indeed continue, with Big Tech tapping capital markets as their cash flow collapsed under their aggressive build-out plans.
The largest surprise over the course of the summer was the steadily higher yield curve, which appeared to react less to inflation concerns — though those persist — and more to the massive government debt load, concerns around the supply and demand for U.S. Treasuries, and uncertainty around the future path of rates.
September 2026
We expect summer dynamics to continue but are uneasy about the yield curve.
With no indication that AI spending will slow, we expect the capex cycle to continue to circulate through the economy in the near term, benefiting companies within industrials, utilities, manufacturing, and technology.
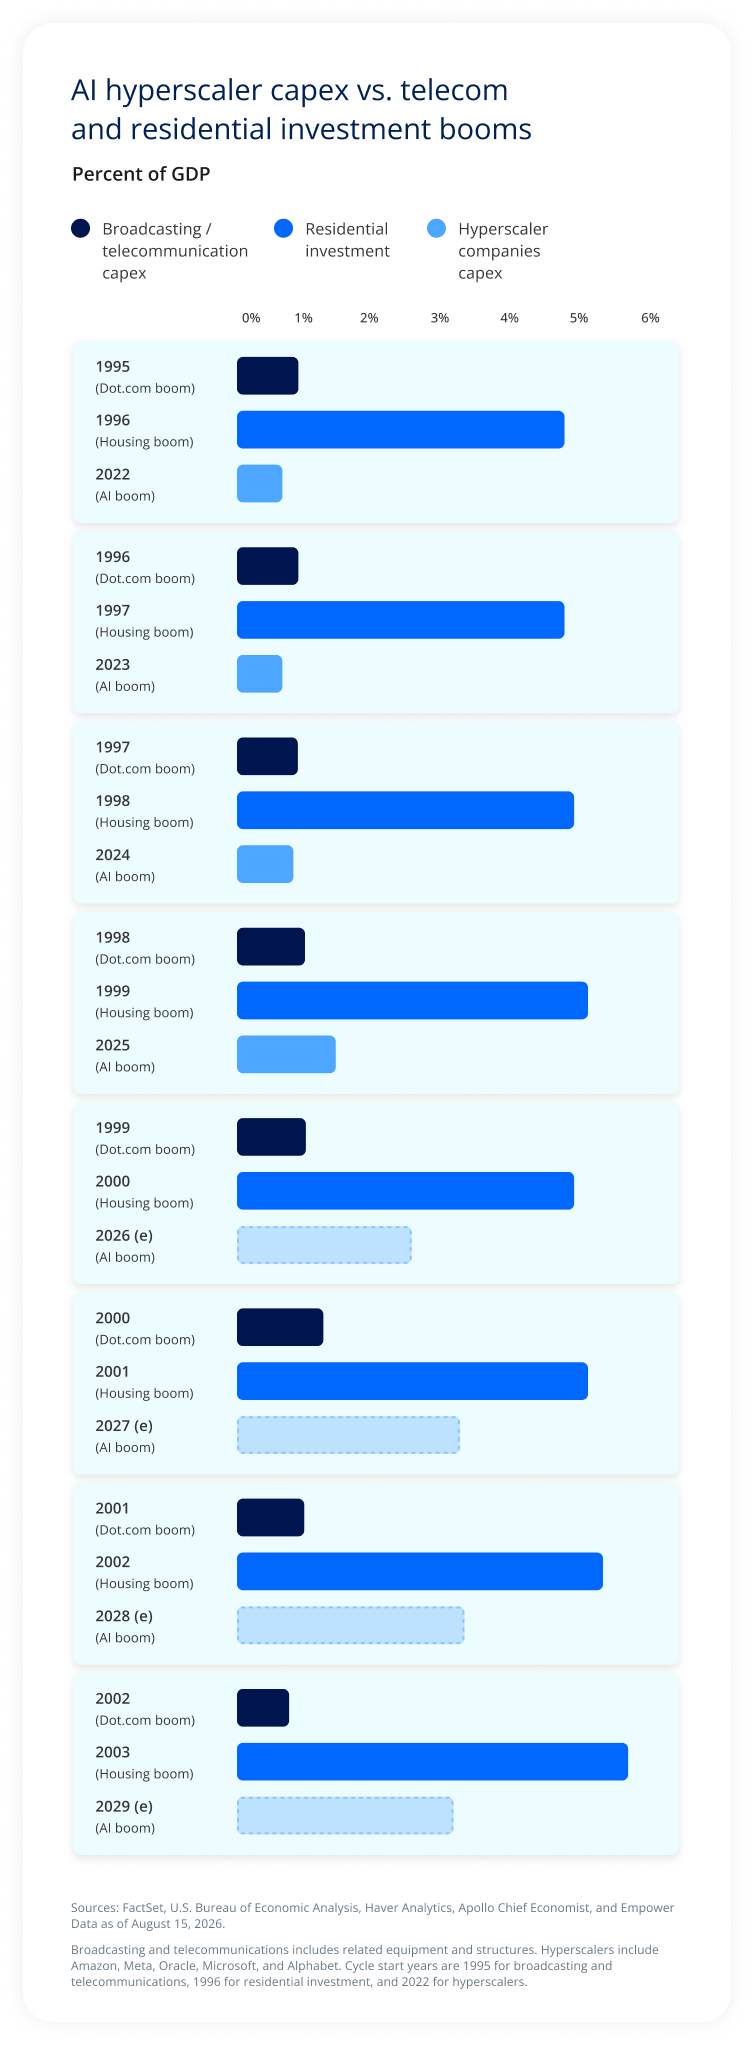
The chart compares investment during three economic booms as a percentage of GDP: broadcasting and telecommunications capital expenditures during the dot-com boom, residential investment during the housing boom, and capital expenditures by AI hyperscalers.
Telecommunications capital spending during the dot-com period generally remained around 1% of GDP from 1995 through 2002. Residential investment during the housing boom was much larger, beginning at roughly 4.8% of GDP in 1996 and increasing to approximately 5.7% by 2003.
Hyperscaler capital expenditures start at well below 1% of GDP in 2022 and increase through 2025. Estimates for 2026 through 2029 show AI-related hyperscaler spending continuing to rise, reaching roughly 3% of GDP at its projected peak before moderating slightly.
Key takeaway: Hyperscaler investment associated with the AI boom is projected to become substantially larger relative to the economy than telecommunications investment during the dot-com boom, but even the projected levels remain well below residential investment during the housing boom.
Hyperscalers in the analysis include Amazon, Meta, Oracle, Microsoft, and Alphabet. Values for 2026 through 2029 are estimates. The comparison aligns the cycles beginning in 1995 for telecommunications, 1996 for residential investment, and 2022 for hyperscalers.
We expect more of the same for the consumer as well; signs of stress, yes, but generally employed and spending, though potentially with less discretionary income than before — particularly given low savings rates, an inflation picture that may not completely abate even as the impact of supply shocks fade, and tax rebates that are largely in the rearview mirror. The larger concern for the consumer is a long-term one: With little housing relief, a major source of wealth building is, at least at the moment, out of reach for many in younger generations.
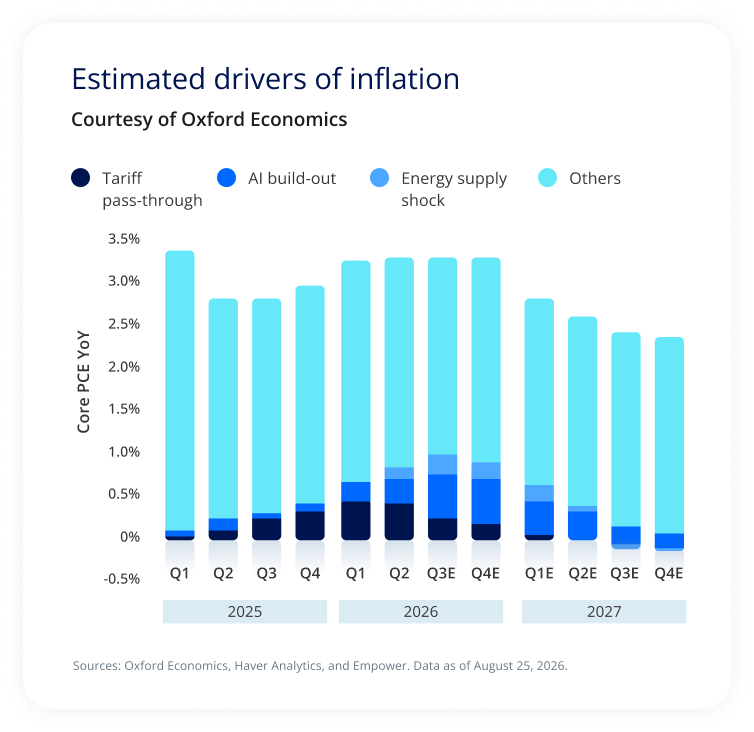
The chart presents Oxford Economics estimates of the drivers of year-over-year core PCE inflation from the first quarter of 2025 through the fourth quarter of 2027.
Overall core PCE inflation is approximately 3.3% in Q1 2025, falls to around 2.8% in Q2 and Q3, and then rises through 2026 to roughly 3.2%–3.3%. The estimates subsequently show inflation declining during 2027, reaching approximately 2.3% by Q4 2027.
Tariff pass-through contributes increasingly to inflation during 2025 and the first half of 2026, peaking at roughly 0.4 percentage points, before declining and largely disappearing during 2027. AI buildout becomes a more prominent contributor during 2026, reaching roughly 0.5 percentage points, before diminishing through 2027.
Energy supply shocks make a smaller positive contribution during parts of 2026 and early 2027 before becoming a slight negative contributor later in 2027. The remaining inflation is attributed to other factors, which account for the largest portion throughout the forecast.
Key takeaway: The estimates suggest tariff pass-through and AI-related investment could add to core inflation during 2026, but those effects are expected to fade during 2027 as overall core PCE inflation moderates.
Source: Oxford Economics, Haver Analytics, and Empower. Data as of August 25, 2026.
But as the status quo grinds on, one variable in particular is worth watching: The yield curve. The move higher over the course of 2026 is a rejoinder to many who expected lower rates. With debt largely fixed and not maturing immediately, the full consequence of higher yields isn’t an immediate concern. And it’s in some ways a positive for lenders and savers, who saw little compensation for the risk they took when buying corporate or government bonds.
Over time, however, the shift from a low rate to a more normal rate environment carries real economic cost, resetting the rates of borrowing for consumers and corporations at more demanding levels than they may expect.
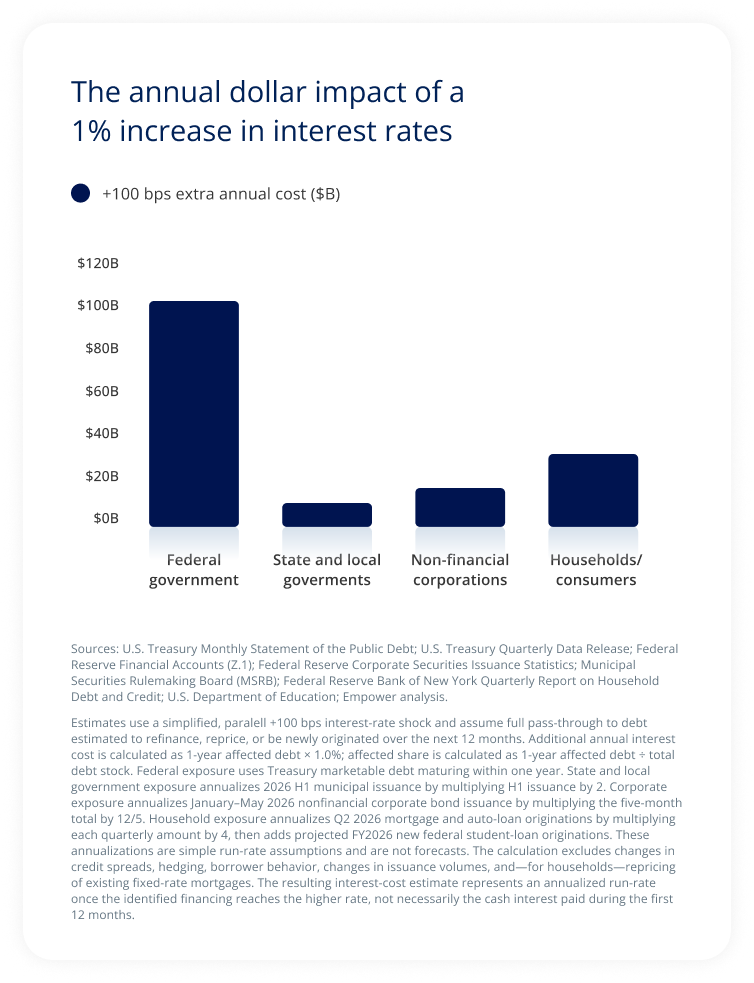
The chart estimates the additional annual interest expense resulting from a 1 percentage point, or 100 basis point, increase in interest rates for four sectors.
The federal government has the largest estimated impact at approximately $100 billion per year. Households and consumers follow at roughly $30 billion, while non-financial corporations face approximately $14 billion in additional annual costs. State and local governments have the smallest estimated impact at roughly $7 billion.
Key takeaway: Under the assumptions used in the analysis, a 1 percentage point increase in interest rates would have substantially different effects across borrowers. The federal government's estimated additional annual interest expense is considerably larger than that of the other sectors shown, while households and consumers represent the second-largest impact.
These figures are estimates based on a simplified, parallel 100-basis-point interest-rate increase and assume full pass-through to debt estimated to refinance, reprice, or be newly originated over the following 12 months. The analysis uses simplified annualization assumptions and does not account for factors such as changes in credit spreads, hedging, borrower behavior, or issuance volumes. The resulting figures represent estimated annualized run-rate costs once affected financing reaches the higher rate, not necessarily cash interest paid during the first 12 months.
Explore the Q4 outlook
Explore the Q4 outlook
Explore the Q4 outlook: Stay up-to-date |
The opinions expressed represent the current, good-faith views of Empower at the time of publication, are provided for limited purposes, and should not be relied upon as investment or legal advice.
Investing involves risk, including possible loss of principal.
Past performance, where discussed, is not a guarantee of future results. Historical trends and economic data discussed may not be indicative of future conditions which may change.
This material is for informational/educational purposes only; it may not be suitable for all investors; is not tailored to any specific investor’s objectives or financial situation; and is not intended as investment, legal, tax, or accounting advice.
This content is based on information available at the time and may change based on more current conditions. This is neither an endorsement of any security, index, sector, or investment, nor a solicitation to offer investment advice or sell products or services offered by Empower or its affiliates. It is impossible to invest directly in an index. References to asset classes or sectors are for illustrative purposes only and are not recommendations.
The information presented was developed internally and/or obtained from sources believed to be reliable; however, Empower does not guarantee the accuracy, adequacy, or completeness of such information.
Predictions, opinions, and other information contained in this communication are subject to change without notice and may no longer be true after the date indicated.
Commentary may contain forward-looking statements based on reasonable expectations, estimates, projections, and assumptions. Forward-looking statements are not guarantees of future performance and involve risks and uncertainties that are difficult to predict.
Fixed-income securities are subject to interest rate risk and inflation risk.
“EMPOWER” and all associated logos and product names are trademarks of Empower Annuity Insurance Company of America.
©2026 Empower Annuity Insurance Company of America. All rights reserved.
INV-WMLPNV-WF-7031510-0926 RO5923819-0926
Investment Insights