


Between the margins July 2026

July 2026
What to watch in Q2 earnings season
July 2026
What to watch in Q2 earnings season

Executive summary
- Expectations suggest this earnings season could be a blowout.
- AI developments deserve close attention, particularly as they relate to the holy grail: monetization.
- I’ll also keep an eye out for signs of the ever-elusive “broadening out.”
- Within the consumer mosaic, credit card payment volume looms large for me.

Earnings season is upon us, and all signs point to a blowout. Take a look below at analyst expectations in our Chart of the month.
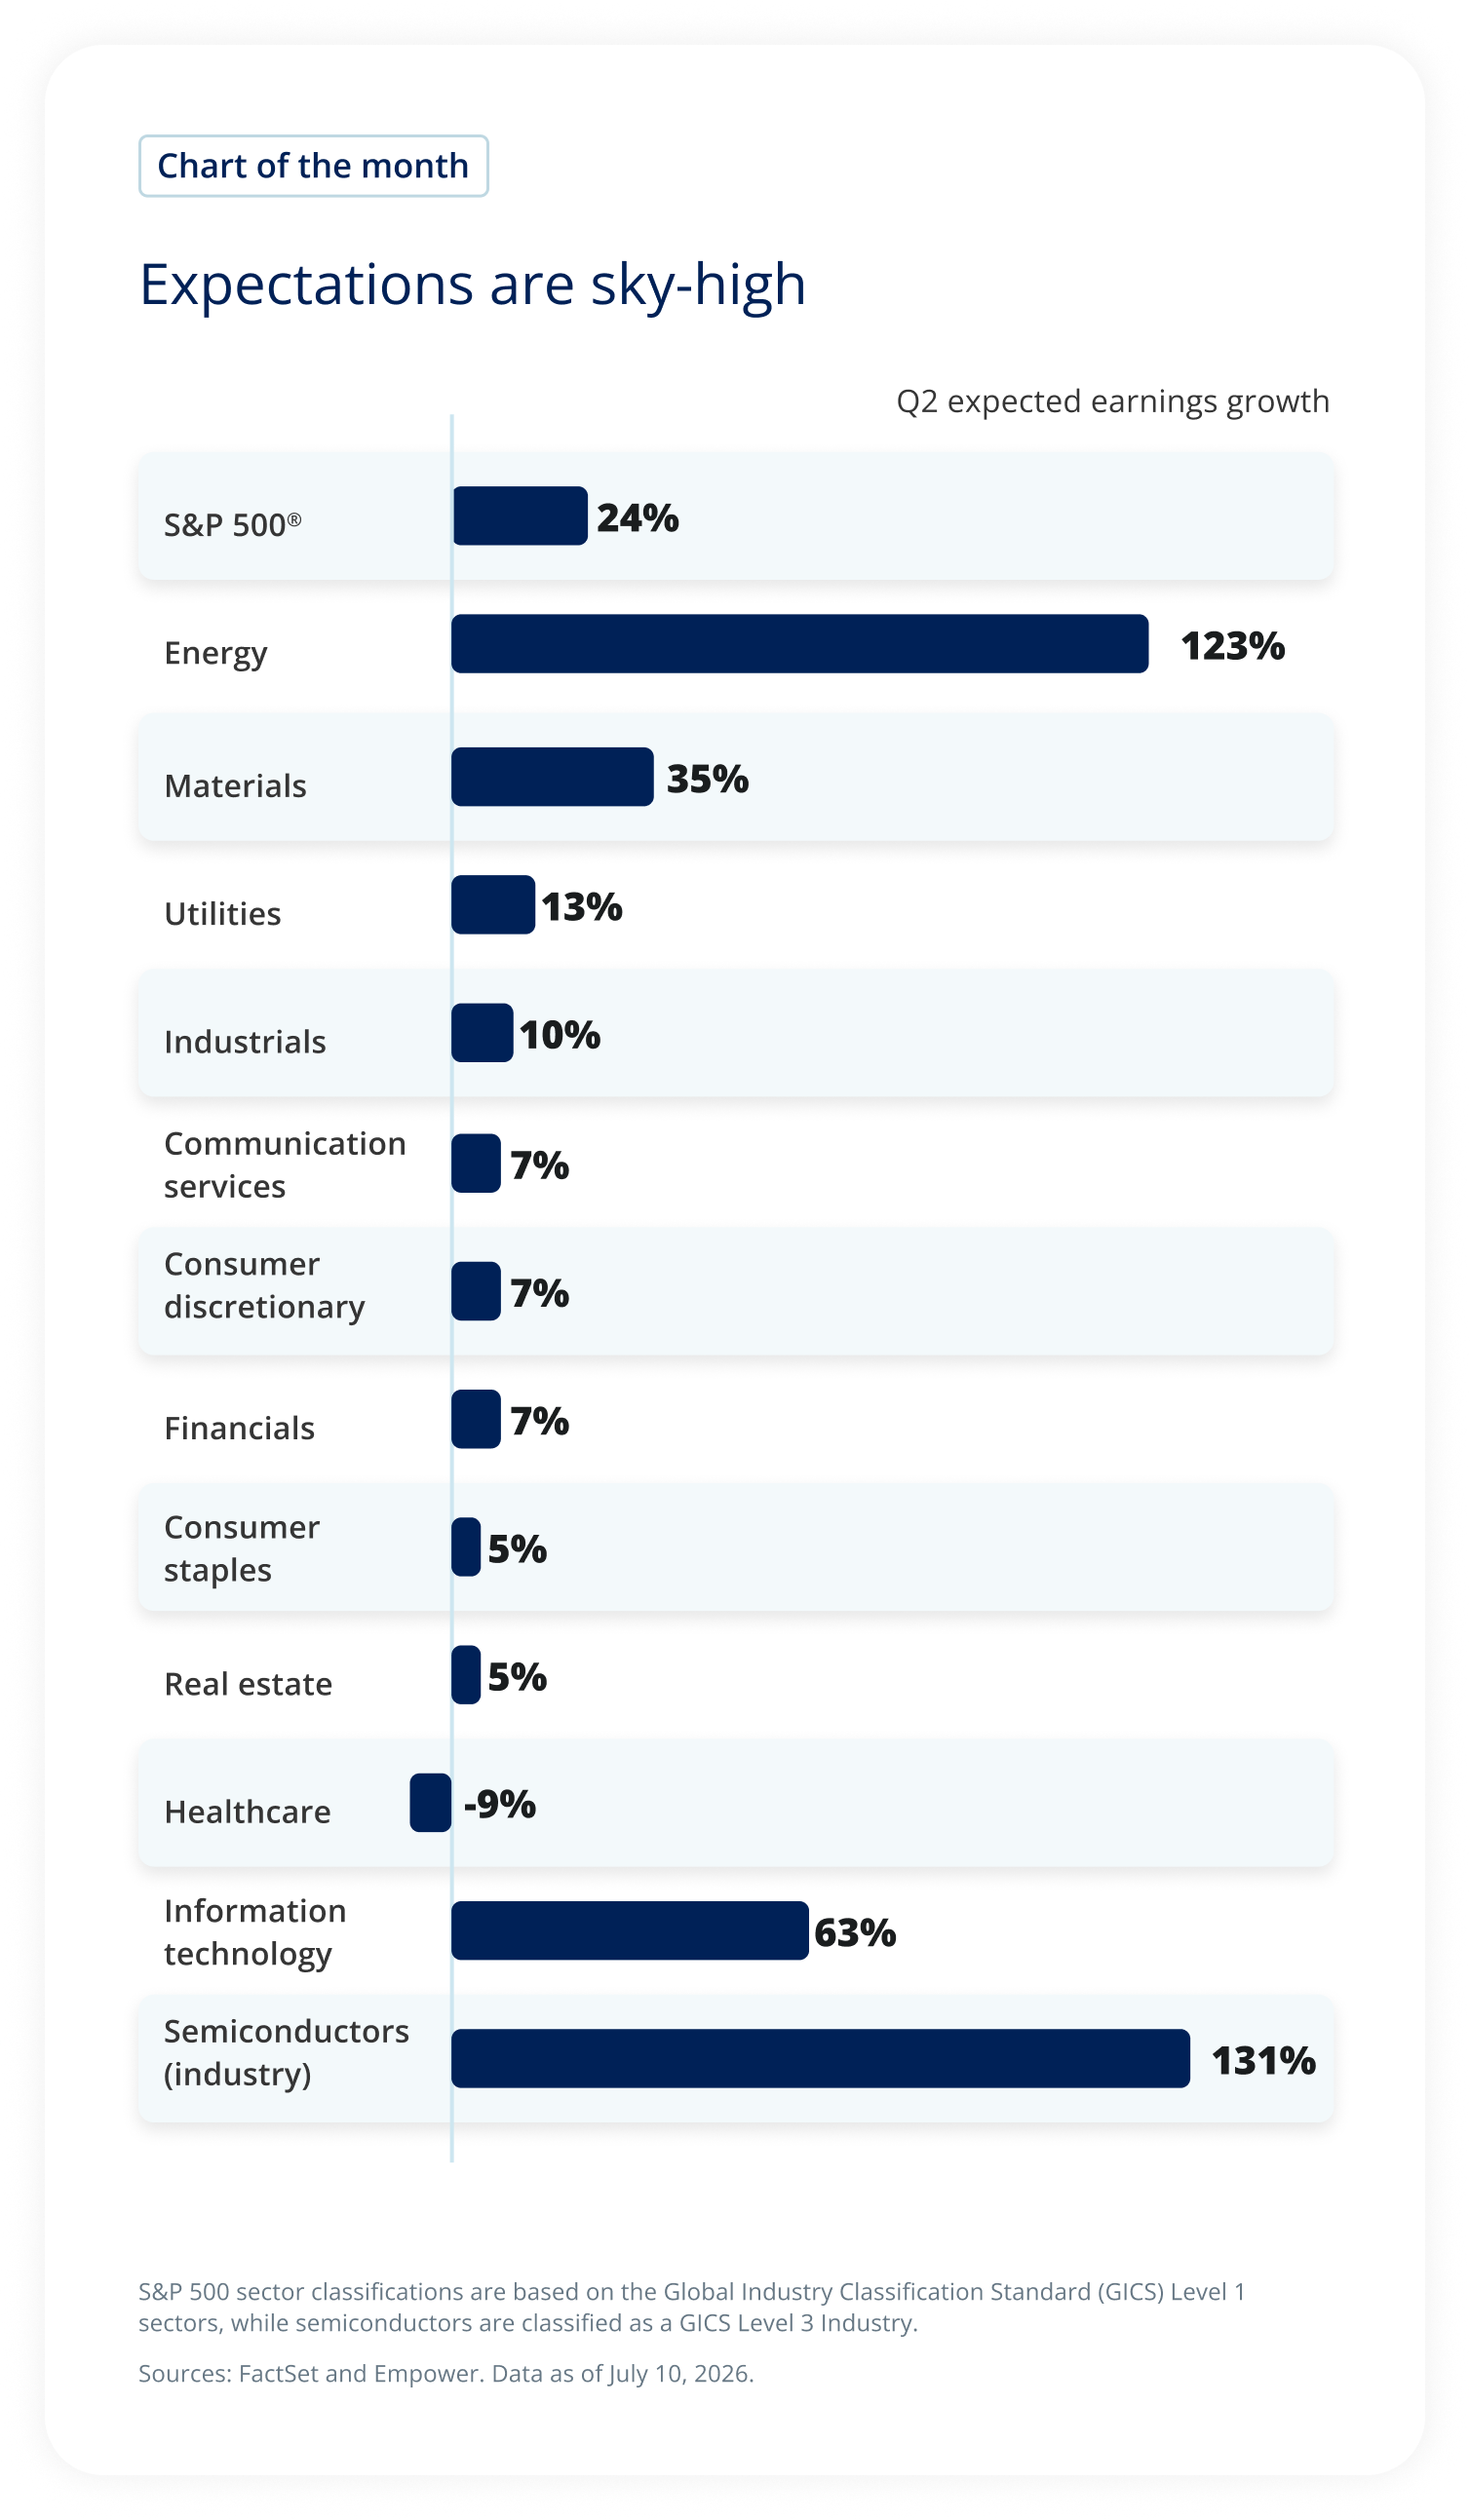
The chart compares expected second-quarter earnings growth across the S&P 500 and its major sectors.
The S&P 500 overall is expected to grow earnings by 24%.
The highest projected growth is in Semiconductors (131%) and Energy (123%), followed by Information Technology (63%) and Materials (35%). Utilities are projected to grow 13%, Industrials 10%, Communication Services 7%, Consumer Discretionary 7%, Financials 7%, Consumer Staples 5%, and Real Estate 5%.
Healthcare is the only sector expected to experience negative earnings growth, at -9%.
The chart's primary takeaway is that earnings expectations are heavily concentrated in a small number of sectors—particularly Energy and Semiconductors—while most sectors are expected to post more modest growth.
With volatile sentiment around the AI trade and valuations at fair to moderately high levels for the broad market, achieving these headline results — actually, surpassing them — is likely critical to continued momentum in U.S. stocks.
But it may very well take more than that, at least for parts of the market.
Below I walk through the three dynamics that I think matter the most this earnings season: the spend and revenue from AI, indications of stronger earnings outside AI, and the health of the U.S. consumer.
The AI checkup
What to watch:
- Capital expenditures and guidance
- Depreciation costs
- Free cash flow
- Cloud revenue
- Memory chips – customer contracts and supply expectations
We hear it almost daily: Estimates suggest that the capital expenditures of Amazon, Meta, Alphabet, Oracle, and Microsoft could reach $700 billion in 2026 alone, almost entirely as part of their efforts to build out AI infrastructure.
That’s roughly the equivalent to the 2024 level of annual spending by Canada.1
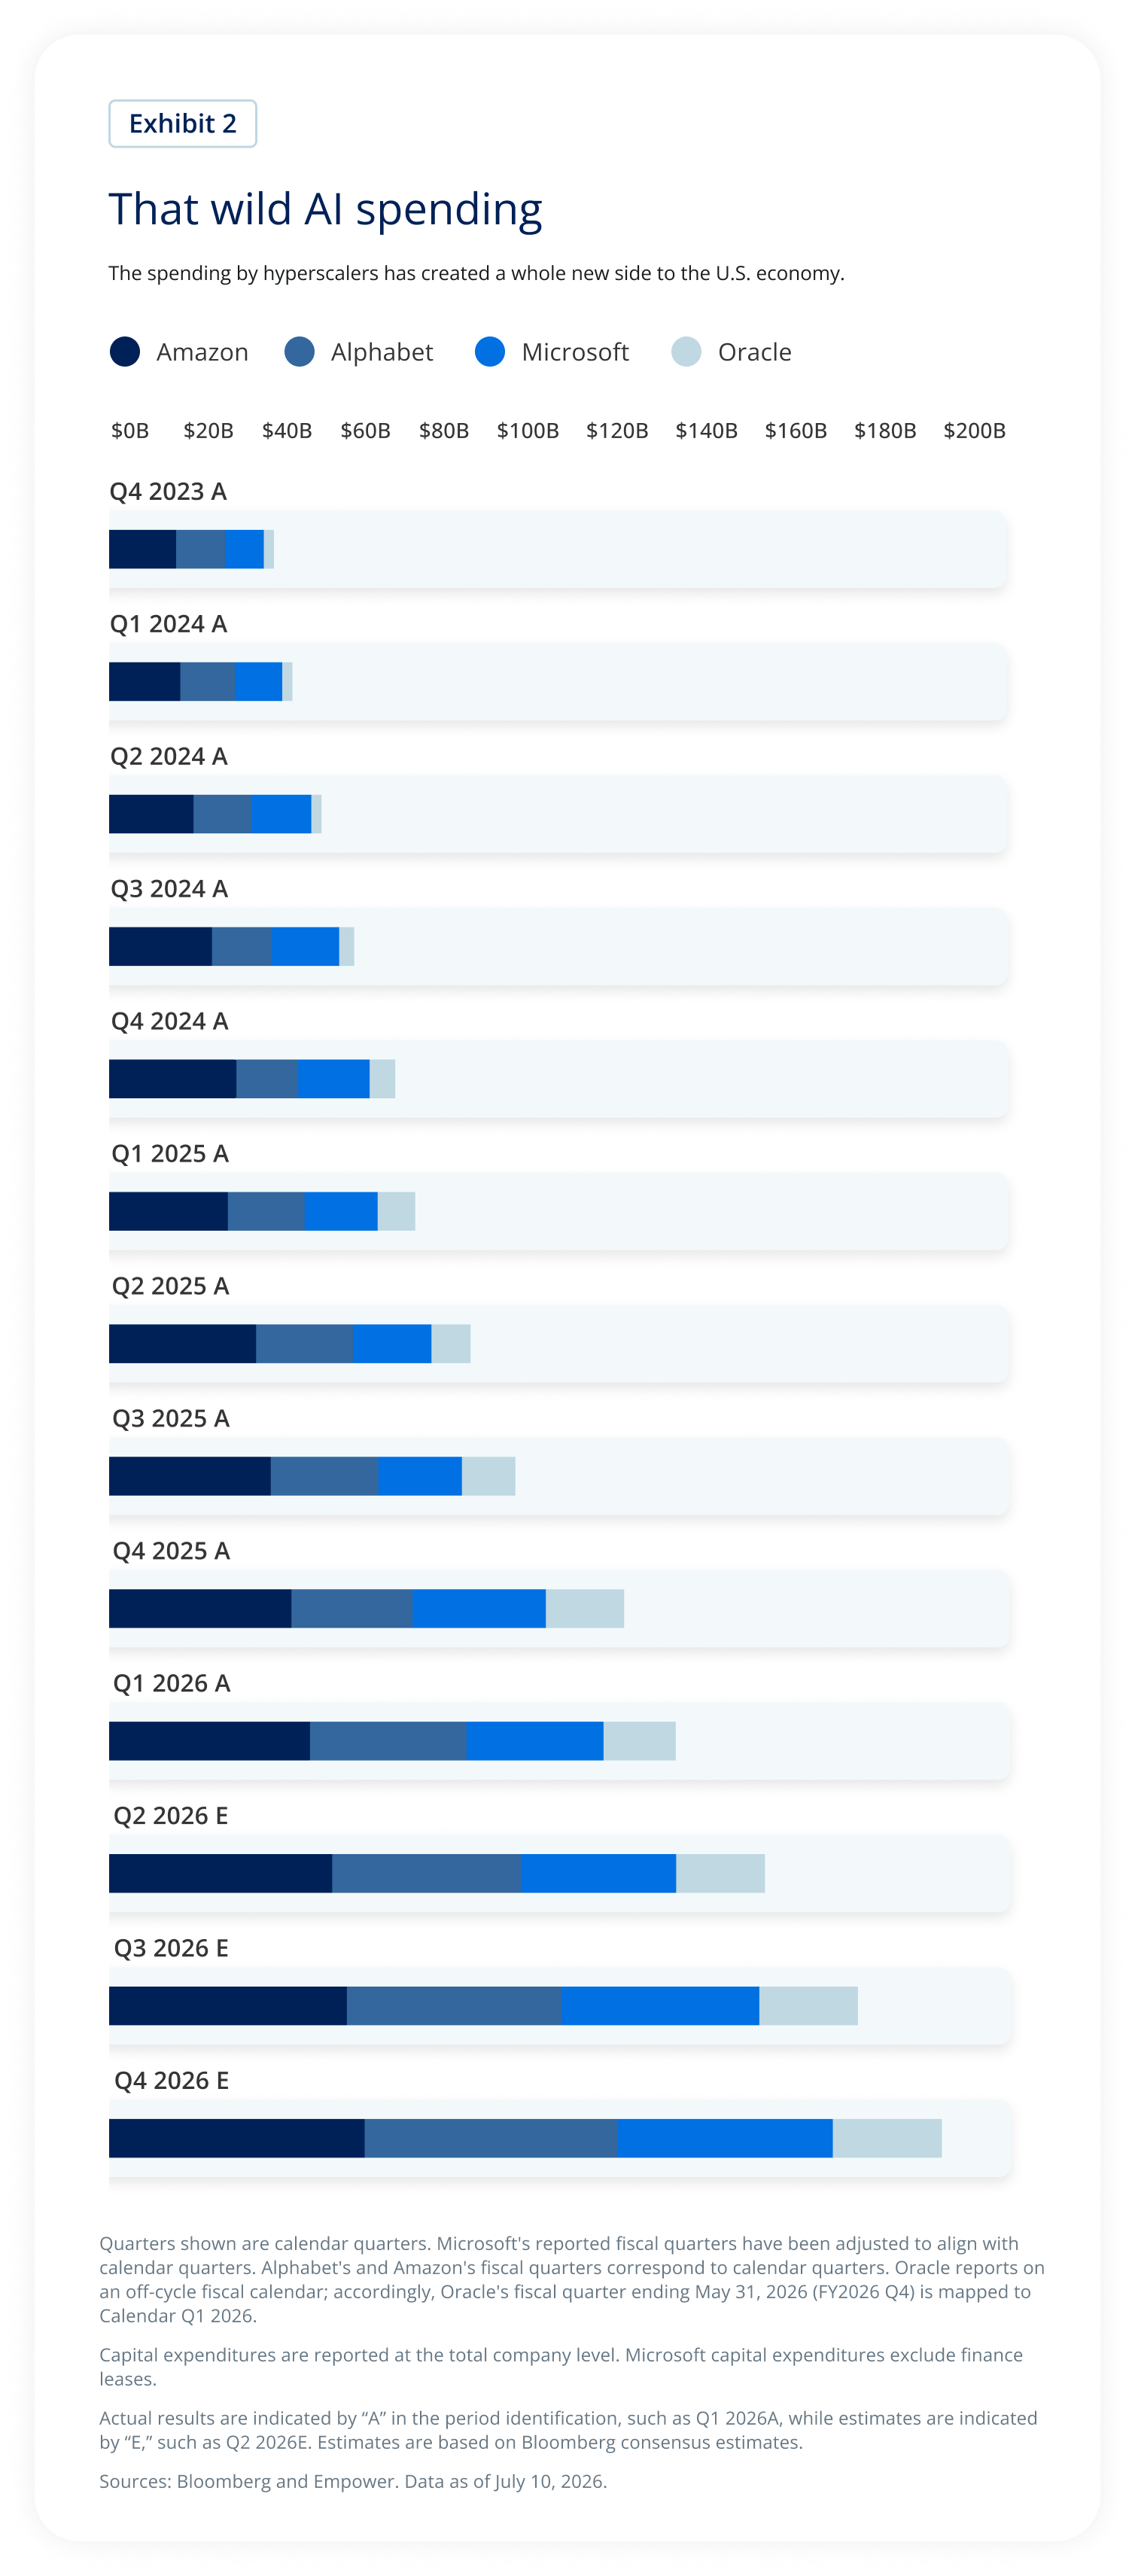
The chart tracks quarterly capital expenditures for Amazon, Alphabet, Microsoft, and Oracle from the fourth quarter of 2023 through projected fourth quarter 2026.
Total spending increases steadily over the period, rising from roughly $35–40 billion in late 2023 to nearly $190 billion by the end of 2026. Each successive quarter generally shows higher combined investment than the previous one.
Contributions from all four companies grow over time, with Amazon, Alphabet, and Microsoft accounting for the largest portions of total spending, while Oracle represents a smaller but increasing share.
Actual results are shown through the first quarter of 2026, with subsequent quarters representing Bloomberg consensus estimates.
The chart's primary takeaway is that capital spending by major cloud providers continues to accelerate as companies invest heavily in artificial intelligence infrastructure.
At that kind of magnitude, each earnings season necessarily revolves around assessing whether the spend is on track, how companies are funding it, and what revenue it ultimately generates.
The details don’t just matter to the hyperscalers. They also matter to the beneficiaries of the spend; in essence, the rest of the AI trade — from the high-flying (or suddenly crashing) chip companies to the commodities embedded in the miles of data-center campuses and the utility and industrial companies that bring them to life.
Should the spend slow, the earnings of these associated companies will also slow.
And at some point soon, the hyperscalers will need to demonstrate that all of this spend has a lucrative end game. Cash flow is disappearing and depreciation costs are building. That’s why cloud revenue matters so much; it’s where the hyperscalers monetize their AI investment, with enterprise customers turning to these cloud providers for AI workflows.
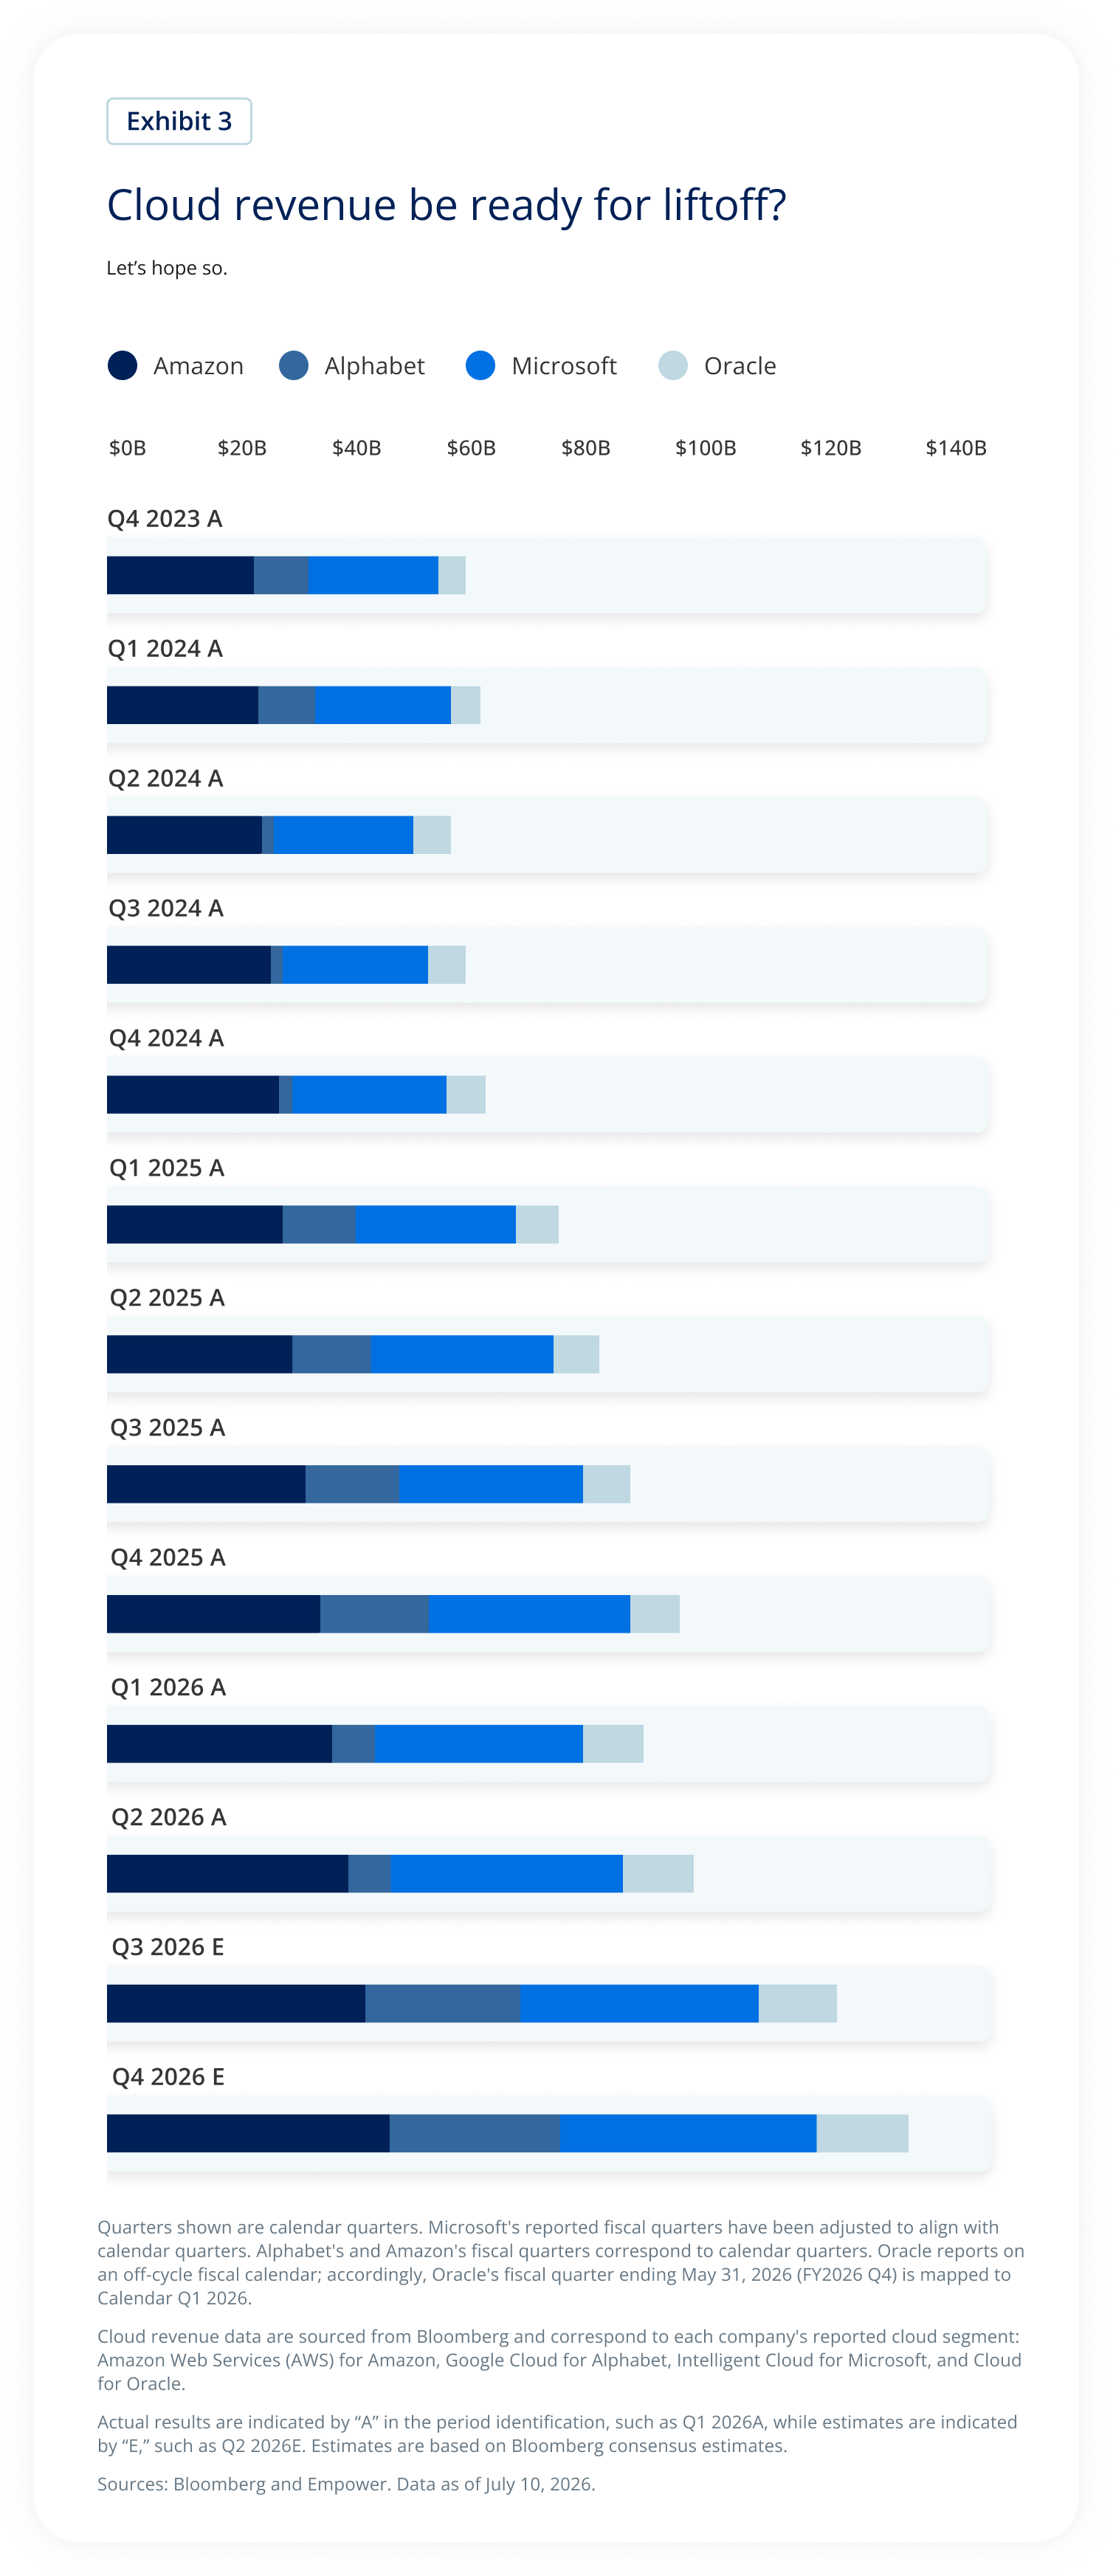
The chart compares quarterly cloud revenue for Amazon, Alphabet, Microsoft, and Oracle from the fourth quarter of 2023 through projected fourth quarter 2026.
Combined cloud revenue increases steadily throughout the period, growing from approximately $55 billion in late 2023 to roughly $130 billion by the end of 2026. Each quarter generally shows higher combined revenue than the previous one.
Amazon and Microsoft contribute the largest portions of total cloud revenue throughout the period, while Alphabet and Oracle also show continued growth. Actual results are shown through the second quarter of 2026, with later quarters representing Bloomberg consensus estimates.
The chart's primary takeaway is that cloud revenue continues to rise across all four major providers, suggesting that cloud businesses are generating increasing revenue that may help support continued investment in artificial intelligence infrastructure.
The hyperscalers offer the clearest picture of the future of the AI trade, but with memory and semiconductors arguably the greatest AI beneficiaries in 2026, investors will also pay close attention to the dynamics of their cycle in addition to the health of the overall AI trade. Listen for signs that demand is durable. Pay attention to new long-term customer commitments, whether companies expect profit margins to hold up as supply increases, and any indication that more chip capacity is coming online.
Broadening out
What to watch:
- Mag 72 versus the 4933 earnings growth
- Results outside the AI trade (parse overarching trends)
2026 was supposed to be the year the market finally broadened beyond technology. And some believe it has, celebrating strong small-cap and emerging-markets performance.
But those headline numbers obscure reality: Within small caps, AI-related gains fueled a meaningful amount of the Q2 rally, and Korea’s and Taiwan’s semiconductor and memory names deserve much of the credit for the emerging-markets performance.
Moreover, when we put market performance aside and focus solely on earnings results, technology remains the epicenter. In fact, during the Q1 earnings season, the hyperscalers surprised massively to the upside, suggesting that the Mag 7 hasn’t yet lost its earnings touch.
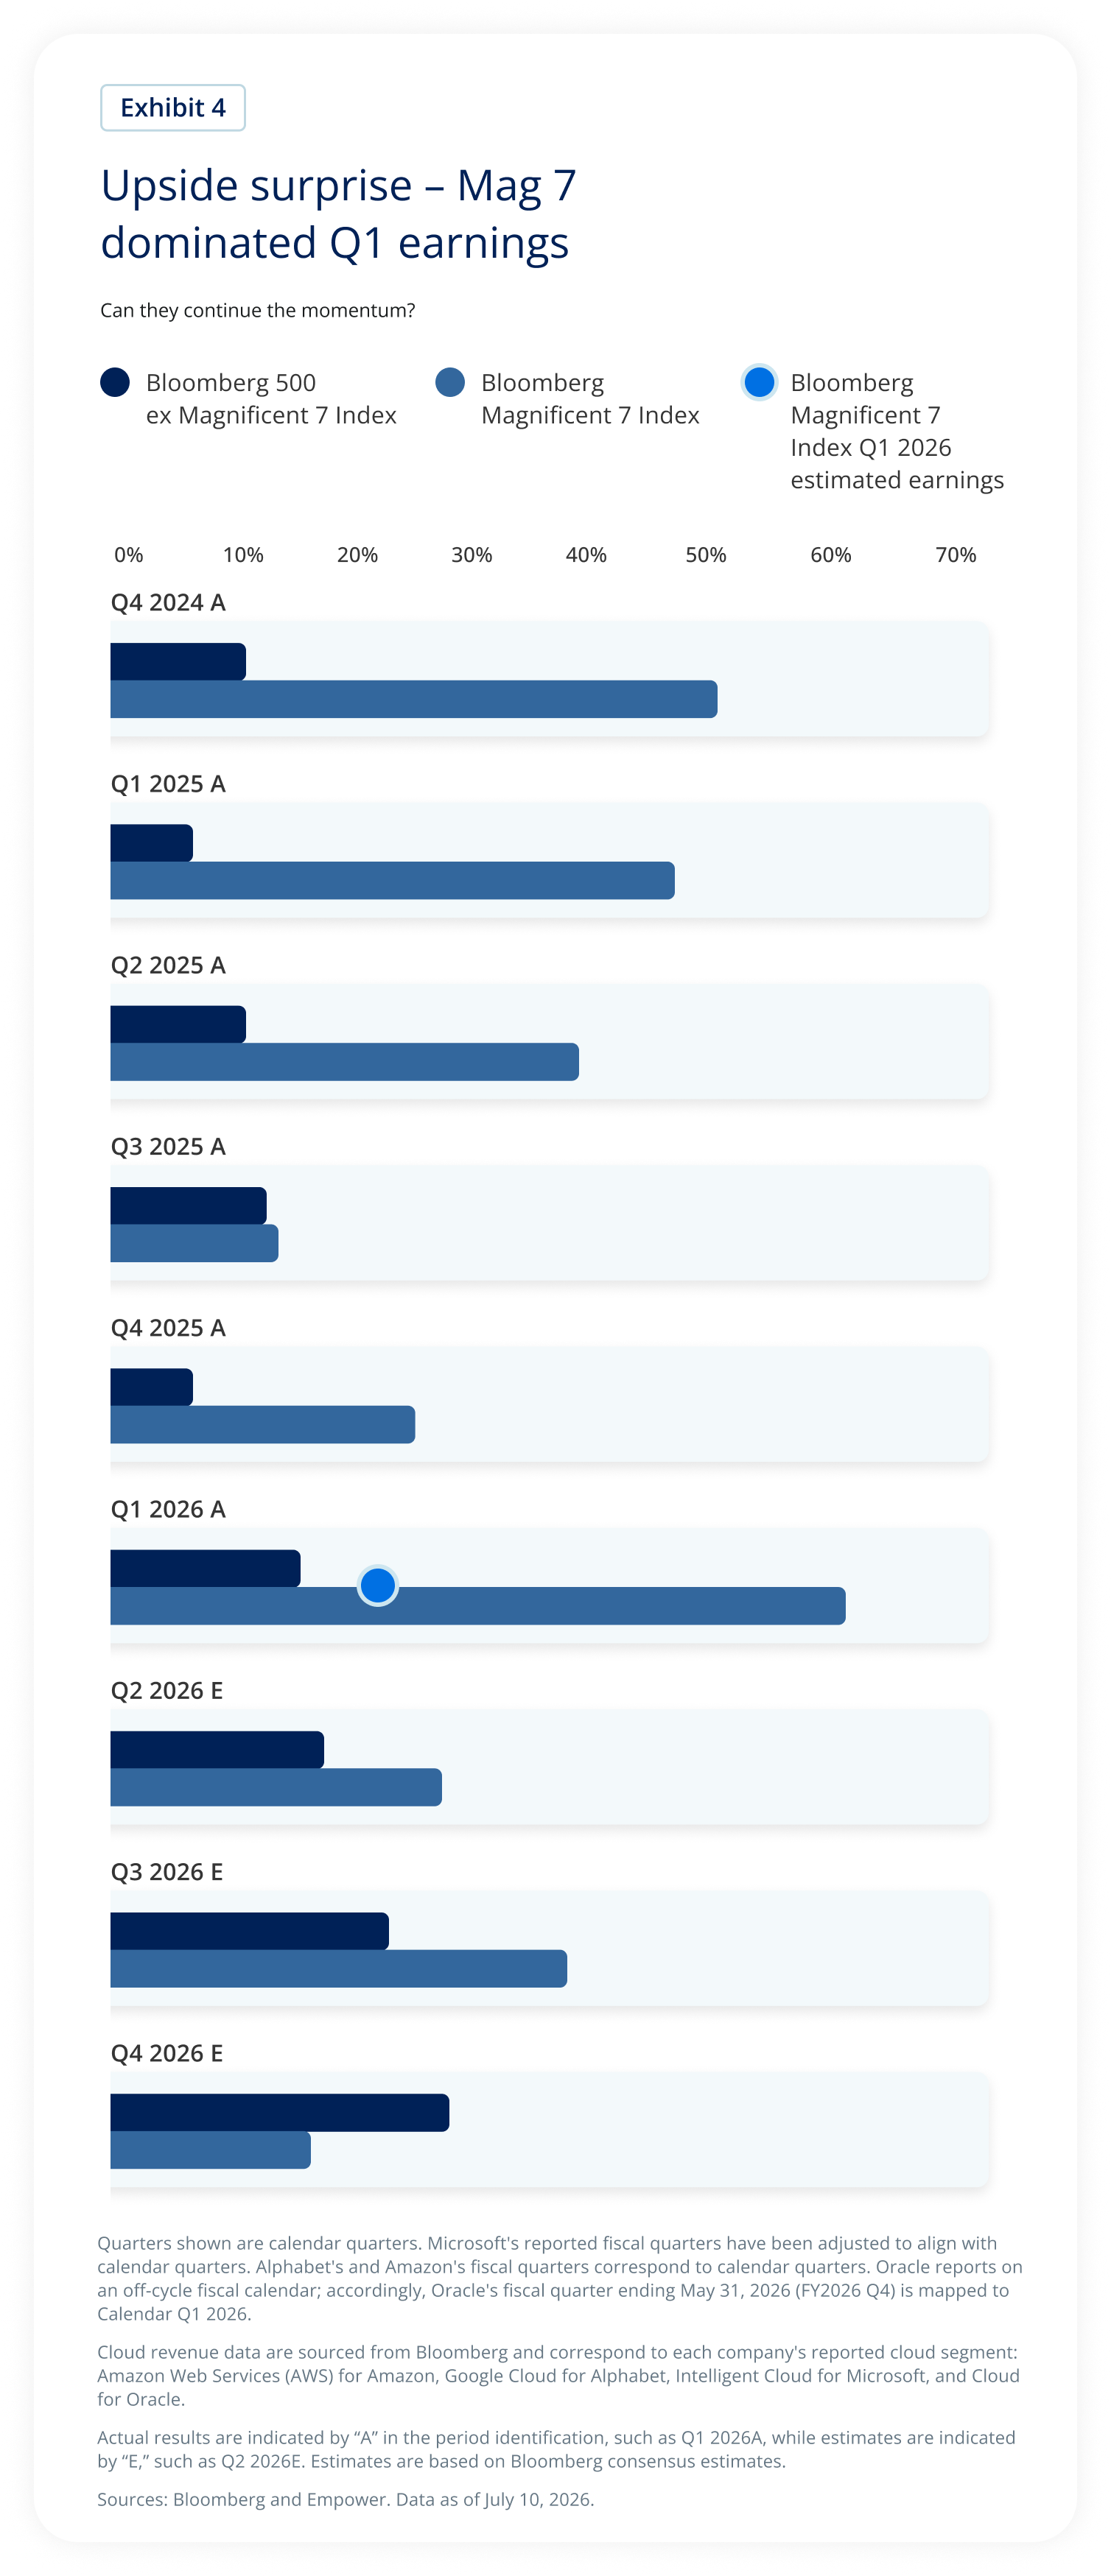
The chart compares quarterly earnings growth for the Bloomberg Magnificent 7 Index with the Bloomberg 500 excluding the Magnificent 7 from the fourth quarter of 2024 through projected fourth quarter 2026.
Throughout the period, the Magnificent 7 generally reports stronger earnings growth than the rest of the S&P 500. The largest divergence occurs in the first quarter of 2026, when the Magnificent 7 posts earnings growth of approximately 61%, compared with about 16% for the S&P 500 excluding those companies.
Looking ahead, Bloomberg consensus estimates project that earnings growth for the Magnificent 7 will moderate during the remainder of 2026 while remaining above or closer to that of the rest of the S&P 500. By the fourth quarter of 2026, projected earnings growth for companies outside the Magnificent 7 slightly exceeds that of the Magnificent 7.
The chart's primary takeaway is that the Magnificent 7 were the primary drivers of first-quarter 2026 earnings growth, but expectations suggest that earnings leadership may broaden to the rest of the market over time.
The forgotten consumer
What to watch:
- Bank consumer insights (so far, so good)
- Retailers: Volume versus prices
- Aggregated results across consumer discretionary companies
- Staples: Volumes and guidance around food prices
- Credit card payment volume
With so much of the market’s enthusiasm centered on AI, it’s easy to forget that other variables matter as well. But beyond giving us a window into the unfolding AI build, earnings also give us a view into the consumer; the pressure facing the low-income cohort (which has suffered the brunt of inflation’s force), the resilience of the high-income cohort (which has benefited from the wealth effect and kept spending aloft), and the preferences and spending patterns within both.
Bank earnings will do a lot of the heavy lifting, and results coming out yesterday and today offer perspective on the consumer’s evolving health (so far, commentary suggests consumers were more resilient than expected). Retailers will further clarify where consumers are spending money, what volume looks like relative to pricing, and consumer preferences across staples and discretionary companies.
But another piece of the consumer mosaic is Visa’s payment volume. Visa captures a large share of card spending across the income spectrum and across a wide range of goods and services. Of course, caveats apply, as always. Like retail sales, inflation can muddy the signal, and shifts in payment habits can as well (digital wallets such as PayPal and Venmo don’t necessarily diminish the value of the data, since many transactions still ride on Visa’s network, although some are funded through bank accounts or balances, instead).
Even with those limitations, Visa’s payment volume provides one of the best real-time gauges of whether the average U.S. consumer is tightening the purse strings or continuing to spend.
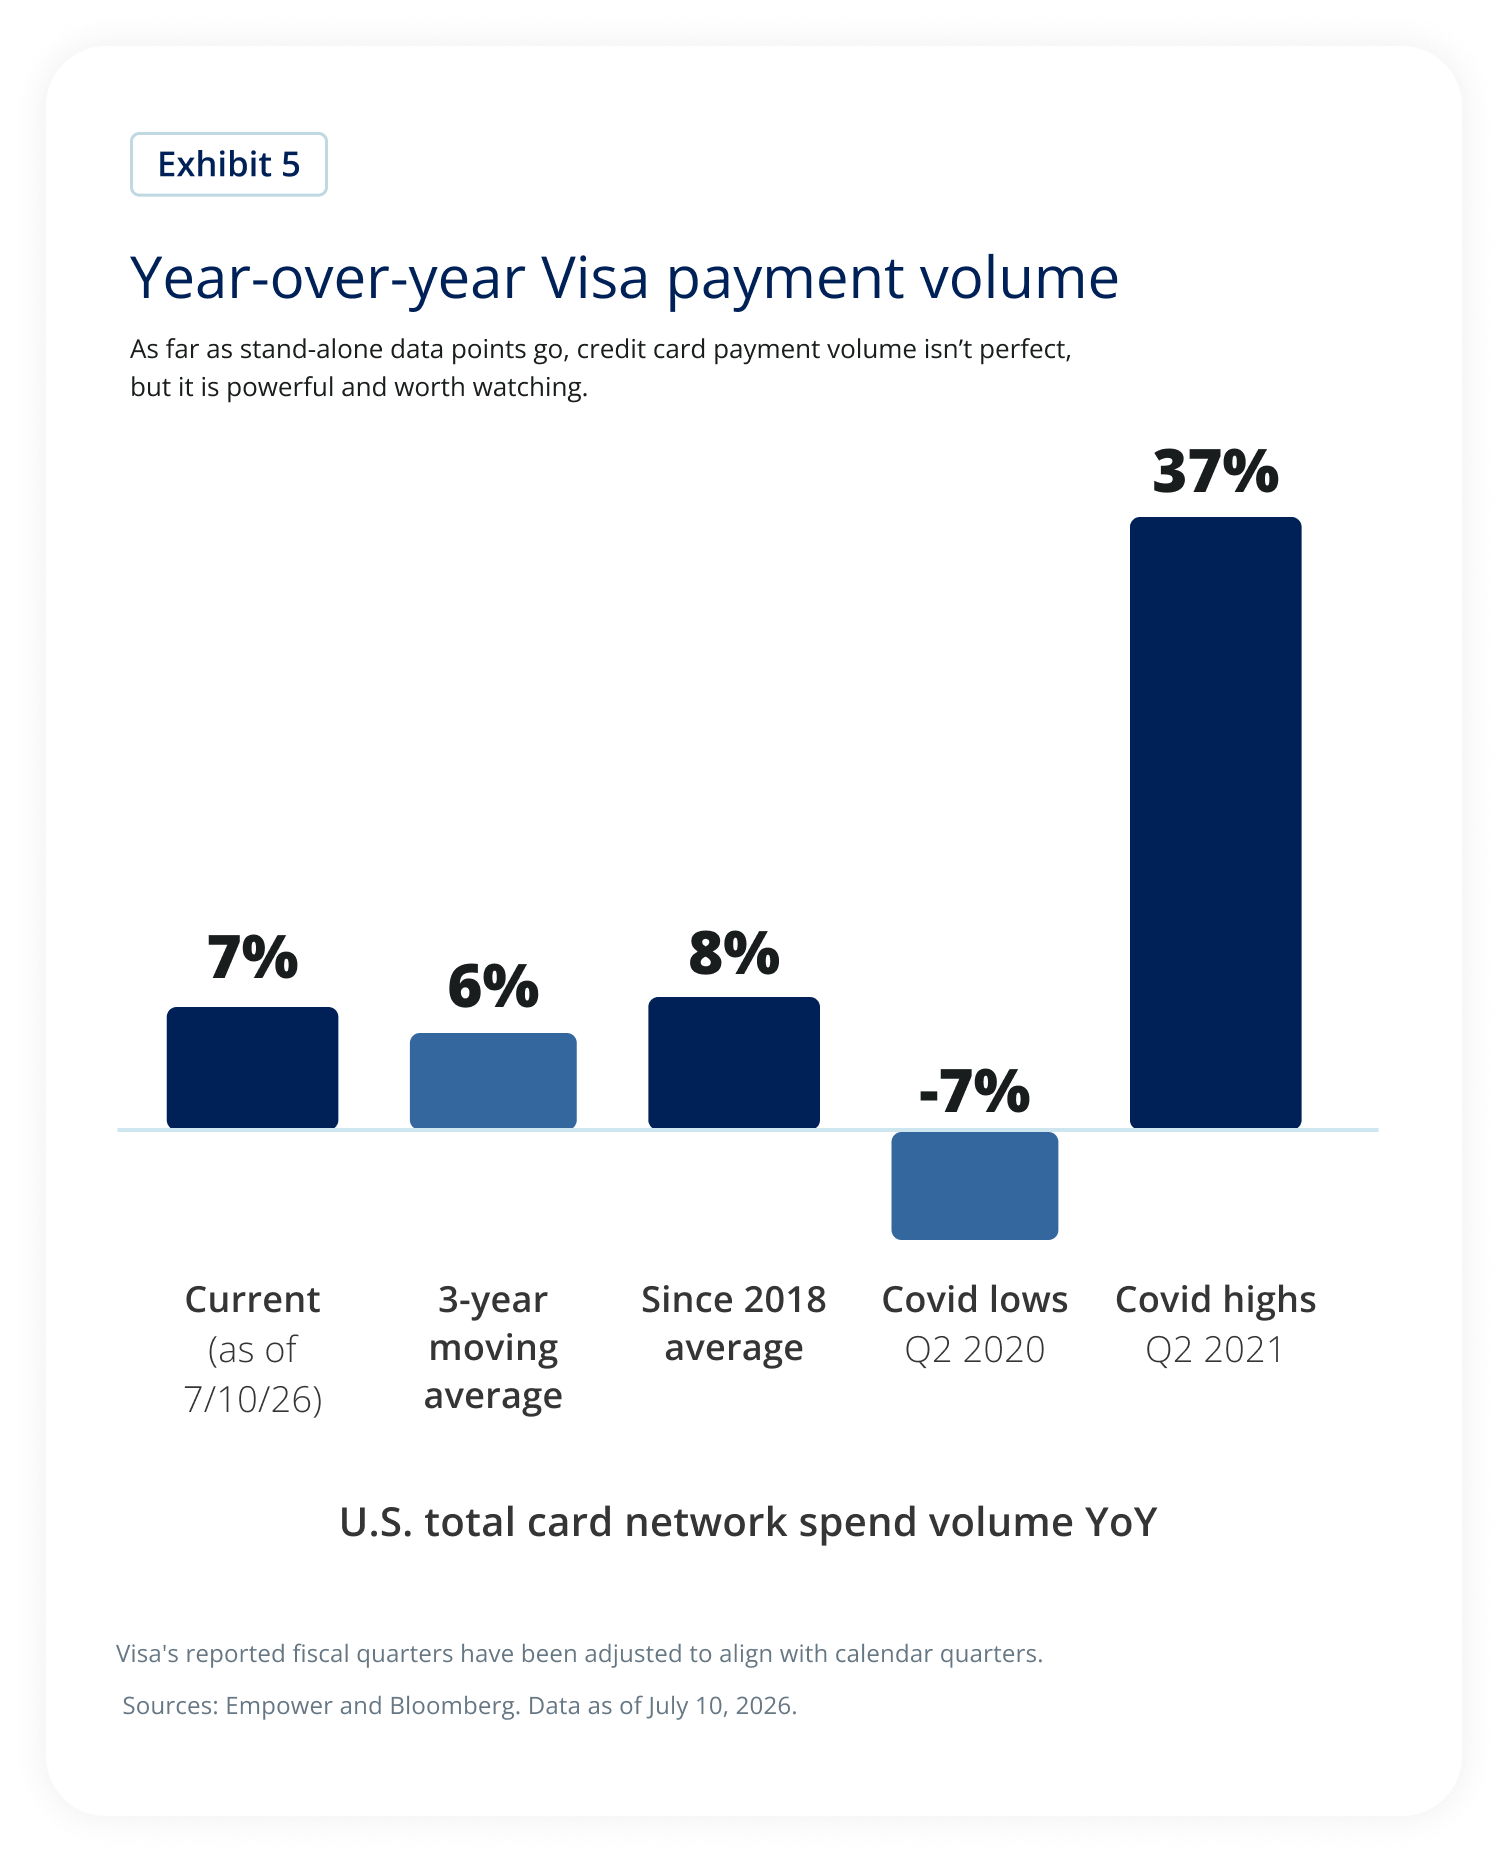
The chart compares several measures of year-over-year U.S. Visa payment volume growth.
As of July 10, 2026, current payment volume growth is 7%, which is close to the 3-year moving average of 6% and the since-2018 average of 8%.
For historical context, payment volume declined 7% during the COVID-19 slowdown in the second quarter of 2020 before rebounding to a 37% increase during the recovery in the second quarter of 2021.
The chart's primary takeaway is that current consumer spending, as measured by Visa payment volume, has normalized to levels that are consistent with long-term averages rather than the unusually weak or strong conditions experienced during the pandemic.
Look for this data on July 28, when Visa reports. The current read? Certainly inflation is boosting the payment volume, but thus far, we aren’t seeing meaningful deterioration — or acceleration. Which is one reason why we continue to say the consumer is resilient, but not euphoric.
What else I’m watching
So obviously earnings are all-consuming in the coming weeks. Then there’s Fed Chair Kevin Warsh and the Fed decision in late July. Will we even have a press conference if there are no task forces to announce? Just kidding. Kinda. I guess we’ll see. IYKYK.
I’ll also keep an ear open for any developments on OpenAI and Anthropic IPOs. And of course there is Iran; the market appears to assume that we aren’t looking at a return of a hot war, but the range of outcomes is, of course, wide.
On that note, a reminder. As news unfolds, I can’t help but think back to the avalanche of alarming headlines at the end of Q1 — the war, the potential economic aftershocks, the constant speculation. But the investors who stayed on course reaped the rewards of the market recovery. Food for thought.
Our mission is to empower financial freedom for all Empower is a customer-obsessed financial services company delivering investment, wealth management, and retirement services to more than 19M people.2 The following tenets guide the development and management of products and solutions we provide to the investors we serve: Commit to an unwavering duty of care Our investors are our priority. We steward every dollar we invest with care, attention, and respect. Emphasize fundamental analysis We keep our eyes on the horizon by rooting our analysis in the underlying drivers of long-term investment returns, not fleeting news and noise. Plan for better outcomes through thoughtful diversification We build resilient portfolios by relying on thoughtful diversification that plans for a range of outcomes, rather than a narrow result. |
Explore previous editions
Stay up to date |
1 Government of Canada, 2024. Canada spent 1.14 trillion in Canadian dollars, which translated to roughly $790 billion at the end of 2024.
2 The Mag 7 (the Magnificent Seven) is a Wall Street nickname for a group of seven mega-cap U.S. companies: Microsoft, Apple, Nvidia, Alphabet, Amazon, Meta Platforms, and Tesla.
3 The 493 refers to the 493 stocks that make up the balance of the S&P 500 Index once the Mag 7 are removed.
4 As of March 31, 2026. Investing involves risk, including possible loss of principal.
Past performance, where discussed, is not a guarantee of future results. Historical trends and economic data discussed may not be indicative of future conditions which may change.
The information presented was developed internally and/or obtained from sources believed to be reliable; however, Empower does not guarantee the accuracy, adequacy, or completeness of such information.
Predictions, opinions, and other information contained in this communication are subject to change without notice and may no longer be true after the date indicated.
Commentary may contain forward-looking statements based on reasonable expectations, estimates, projections, and assumptions. Forward-looking statements are not guarantees of future performance and involve risks and uncertainties that are difficult to predict.
This material is for informational/educational purposes only; it may not be suitable for all investors, not tailored to any specific investor’s objectives or financial situation and is not intended as investment, legal, tax, or accounting advice.
The opinions expressed represent the current, good-faith views of Empower at the time of publication, are provided for limited purposes, and should not be relied upon as investment or legal advice.
This content is based on information available at the time and may change based on more current conditions. This is neither an endorsement of any security, index, sector, or investment, nor a solicitation to offer investment advice or sell products or services offered by Empower or its affiliates. It is impossible to invest directly in an index. References to asset classes or sectors are for illustrative purposes only and are not recommendations.
Empower and its affiliates are not providing impartial investment advice in a fiduciary capacity with respect to this material. Plan fiduciaries are solely responsible for the selection and monitoring of investment options and for determining the reasonableness of plan fees and expenses.
The S&P 500® Index and associated data are products of S&P Dow Jones Indices LLC, its affiliates and/or licensors and have been licensed for use by Empower Retirement, LLC. ©2026 S&P Dow Jones Indices LLC. All rights reserved. Redistribution or reproduction without written permission is prohibited. S&P® and Dow Jones® are registered trademarks of their respective owners. S&P Dow Jones Indices LLC and its affiliates/licensors make no representation or warranty regarding index accuracy or performance and have no liability for errors, omissions, or interruptions.
Bloomberg® and the referenced indices are trademarks or service marks of Bloomberg Finance L.P. and its affiliates. Bloomberg and any third-party providers are not affiliated with Empower and do not approve, endorse, review, or recommend the financial products referenced. Bloomberg does not guarantee the timeliness, accuracy, or completeness of any data related to the indices or financial products.
International investing involves additional risks not typically associated with U.S. investments, including currency fluctuations, differences in accounting standards, and economic and political instability. These risks may be heightened in emerging markets, which may be more volatile and less liquid than developed markets.
Empower refers to the products and services offered by Empower Annuity Insurance Company of America and its subsidiaries.
“EMPOWER” and all associated logos and product names are trademarks of Empower Annuity Insurance Company of America.
©2026 Empower Annuity Insurance Company of America. All rights reserved. INV-WMLPNV-WF-6659018-0726 RO5743828-0726