
Wealth Watch: What Americans spent and saved in 2025
Wealth Watch: What Americans spent and saved in 2025
Empower Personal DashboardTM data reveals financial trends this year. How do your money habits compare?
Wealth Watch: What Americans spent and saved in 2025
Empower Personal DashboardTM data reveals financial trends this year. How do your money habits compare?

12.10.2025
Key takeaways:
- Americans’ biggest spending categories in 2025 were travel, general merchandise, and restaurants — though electronics, hobbies, and pet care saw the largest relative increases year-over-year.
- Discretionary spending remains resilient, with consumers willing to invest in wellness and convenience even as they show early signs of tightening around smaller, everyday indulgences.
- Gen Z grew their wealth in percentage terms more than any other generation this year across both 401(k) savings (+14%) and overall net worth (+3%), with Millennials following closely behind.
Americans spent more in 2025 on travel, merchandise, and experiences while essentials continued to rise, yet many still boosted savings — especially Gen Z.
What Americans spent this year
Americans continued to navigate rising costs in 2025, with essential expenses climbing across most major categories and discretionary spending showing pockets of strong growth. According to Empower research, 54% of Americans say the cost of living rose in 2025, though 28% feel more optimistic now than they did in January. An analysis of average monthly credit card activity across 20 spending categories reveals where household budgets tightened — and where consumers were still willing to spend.
Average monthly credit card spending 2025 vs. 2024
Spend category | 2025 avg. | 2024 avg. | % change |
Travel | $1,210.54 | $1,098.32 | 10.22% |
General merchandise | $995.34 | $916.92 | 8.55% |
Restaurants | $896.14 | $824.78 | 8.65% |
Insurance | $731.68 | $662.59 | 10.43% |
Home improvement | $672.14 | $651.69 | 3.14% |
Groceries | $658.69 | $648.13 | 1.63% |
Home maintenance | $640.79 | $589.21 | 8.75% |
Clothing and shoes | $614.70 | $624.89 | -1.63% |
Automotive | $557.21 | $521.99 | 6.75% |
Healthcare and medical | $486.93 | $442.44 | 10.05% |
Utilities | $449.36 | $426.83 | 5.28% |
Charitable giving | $403.76 | $391.68 | 3.08% |
Entertainment | $376.99 | $355.09 | 6.17% |
Pets and pet care | $350.22 | $314.06 | 11.51% |
Personal care | $276.48 | $257.24 | 7.48% |
Electronics | $271.77 | $216.05 | 25.79% |
Gas | $232.62 | $241.92 | -3.85% |
Telephone | $222.02 | $208.88 | 6.29% |
Cable | $182.78 | $173.52 | 5.34% |
Hobbies | $163.86 | $140.75 | 16.41% |
Data compares whole-month averages from January–November 2025 with the same period in 2024.
Spending spotlights
Electronics lead the increases
Electronics posted the sharpest year-over-year jump, rising nearly 26%. The surge suggests many households may have replaced or upgraded devices, as computers (-0.7%), televisions (-6%) and smartphones (-14.9%) all saw falling prices year-over-year, per September’s Consumer Price Index (CPI).1
Pets and hobbies spending surge
Spending on pets and pet care rose more than 11%, one of the fastest increases across all categories. The growth highlights the continued prioritization of pet-related costs, even as other discretionary areas remain volatile. Hobbies, meanwhile, climbed more than 16%, pointing to renewed interest in hands-on activities and at-home pursuits.
Core costs keep pressuring budgets
Insurance payments rose more than 10%, posting one of the steepest increases among essential categories. Healthcare and medical spending saw a similar jump, underscoring the rising baseline cost of daily life.
Experience spending remains resilient
Despite higher costs, Americans continued spending on experiences in 2025. Travel spending rose more than 10%, remaining the single largest expenditure category. Restaurant spending increased nearly 9%, showing consistent demand for dining out. Entertainment-related purchases rose over 6%. Together, the transactions point to the growing “experience economy” — an area that’s expected to reach $2.1 trillion by 2031, as consumers invest their disposable income in memory-making over material possessions.
Filling closets and fuel tanks
Clothing and shoes dipped slightly from last year, while gas spending fell nearly 4%. In 2025, spending on clothing and shoes averaged almost $615 per month, while fuel claimed around $233 of the monthly budget. Gas is down 0.5% year-over-year, per September’s CPI.2
The cost of necessities alone
Discretionary habits vary widely by household, but essential categories — groceries, utilities, insurance, healthcare, auto costs, gas, home maintenance, and telephone — totaled roughly $4,000 per month.
From coffee runs to gym fees: Other spending trends
🏋️ Wellness spending is accelerating, with gym membership spending seeing the largest increase both in dollars and growth rate from $85.50 to $101.80, a 19% jump.
🍕 Convenience habits remain entrenched, with food delivery still a dominant spending bucket in the discretionary category. Spending increased from $162.40 to $179, up 10.2%.
📺 Subscription creep continues, but with smaller dollar impact. Streaming service spending grew modestly from $26.50 to $29.80 — a 12.5% increase — which could reflect incremental price increases across platforms.3
☕ Everyday splurges, like grabbing a coffee, show more restrained growth — possibly an early sign of consumer cost-consciousness or trading-down to cheaper options. Coffee chain spending edged up from $42.70 to $45.50, a 6.6% increase.
🚗 Demand for on-the go transportation remains resilient. Rideshare spending ticked up from $110.40 to $119.10, a 7.9% increase.
What Americans saved this year
People say discipline and consistency (32%) are the most important factors for building wealth, followed by living within your means (28%) and sticking to a financial plan (26%), according to Empower research. Many Americans made significant progress on their wealth goals in 2025, growing 401(k) balances and overall net worth.
Growth of 401(k) balances through 2025
Here's how much Americans grew their 401(k) balance on average in 2025, by generation:
Generations | Avg. 401(k) (Jan) | Avg. 401(k) (Nov) | Difference |
Gen Z (18-26) | $78,978 | $89,963 | 13.91% |
Millennials (27-42) | $203,703 | $224,284 | 10.11% |
Gen X (43-58) | $520,086 | $548,237 | 5.41% |
Boomers (59-77) | $573,642 | $566,479 | -1.25% |
Includes combined employee and employer contributions, as well as any investment earnings. Data reflects whole month averages from January 2025 through November 2025.
Read more: Here's what saving 1% more could mean for your retirement
Growth of net worth through 2025
Here's how much Americans added to their total net worth in 2025, by generation:
Generations | Avg. net worth (Jan) | Avg. net worth (Nov) | Difference |
Gen Z (18-26) | $93,736 | $96,869 | 3.34% |
Millennials (27-42) | $336,505 | $345,601 | 2.70% |
Gen X (43-58) | $1,124,733 | $1,116,196 | -0.76% |
Boomers (59-77) | $1,674,057 | $1,576,635 | -5.82% |
Data reflects whole month averages from January 2025 through November 2025.
Gen Z grew their wealth in percentage terms more than any other generation this year across both 401(k) savings and overall net worth, according to Empower Personal Dashboard data. Younger people — especially Gen Z — are increasingly turning away from homeownership and instead investing in the stock market as a new primary method for building wealth.4 Research shows that those born between 1997 and 2012 are outpacing earlier generations when it comes to saving for retirement, having more than three times the assets in their 401(k) retirement savings accounts than Gen X households had at the same time in 1989, adjusted for inflation.5
Millennials, typically in their peak earnings years, have also seen notable growth in 401(k) balances and net worth this year to date: 401(k) balances have increased by over 10%, while the cohort’s overall net worth has risen by almost 3%.
Read more: Roth IRAs account for nearly a third of Gen Z and Millennial retirement savings
Gen X’s 5% rise in 401(k) balances alongside a small decline in net worth may point to sandwich-generation pressures, like caring for parents or paying for college, as well as weaker performance in other assets.
Boomers are seeing modest declines in savings as more transition into retirement, when required withdrawals and reduced contributions naturally shrink account balances.
Empower research shows Americans prioritized their financial future by building emergency savings (37%), contributing to their retirement savings (36%), and investing in the stock market (34%) this year.
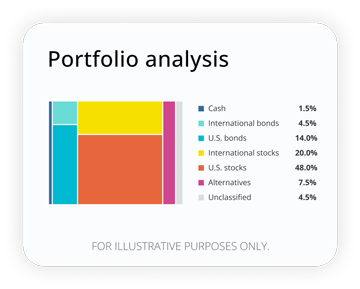
How well are your investments performing?
Analyze your portfolio in minutes and receive a target allocation for your goals.
1 Bureau of Labor Statistics, “Consumer Price Index – September 2025,” October 2025.
2 Ibid.
3 Yahoo, “Every Streaming Cost Increase In 2025: HBO Max Sets Price Hike Across All Tiers,” October 2025.
4 Business Insider, “Young people locked out of the housing market are turning to the stock market to start building wealth,” September 2025.
5 Investment Company Institute, “Gen Z Saving for Retirement Earlier Than Generations Before Them.” February 2024.
RO5052792-1225


The Currency editors
Staff contributors
The CurrencyTM writers and editors cover the latest financial news and insights shaping how we live, work, and play. The team provides accurate, data-driven, and timely content aimed at empowering financial freedom for all.
The content contained in this blog post is intended for general informational purposes only and is not meant to constitute legal, tax, accounting or investment advice. You should consult a qualified legal or tax professional regarding your specific situation. No part of this blog, nor the links contained therein is a solicitation or offer to sell securities. Compensation for freelance contributions not to exceed $1,250. Third-party data is obtained from sources believed to be reliable; however, Empower cannot guarantee the accuracy, timeliness, completeness or fitness of this data for any particular purpose. Third-party links are provided solely as a convenience and do not imply an affiliation, endorsement or approval by Empower of the contents on such third-party websites. This article is based on current events, research, and developments at the time of publication, which may change over time.
Certain sections of this blog may contain forward-looking statements that are based on our reasonable expectations, estimates, projections and assumptions. Past performance is not a guarantee of future return, nor is it indicative of future performance. Investing involves risk. The value of your investment will fluctuate and you may lose money.
Certified Financial Planner Board of Standards Inc. (CFP Board) owns the certification marks CFP®, CERTIFIED FINANCIAL PLANNER™, CFP® (with plaque design), and CFP® (with flame design) in the U.S., which it authorizes use of by individuals who successfully complete CFP Board's initial and ongoing certification requirements.