
Becoming the 401(k) millionaire next door
Becoming the 401(k) millionaire next door
Here’s how Empower Personal DashboardTM users spend, save, and invest to get there
Becoming the 401(k) millionaire next door
Here’s how Empower Personal DashboardTM users spend, save, and invest to get there

07.21.2026
Key takeaways
- 21.9% of people have an average of more than $1 million in retirement savings
- Retirement millionaires have saved nearly $2.5 million on average
- People are reaching retirement millionaire status in their 50s, with average balances of $1,073,368
Who wants to be a 401(k) millionaire?
Empower Personal DashboardTM data shows more than one in five people (21.9%) fall into the category of 401(k) millionaire as of June 30, 2026, having accumulated at least $1 million in retirement savings in employer-sponsored plans and individually controlled IRA savings and investment accounts.
As of June 30, 2026, there were 1,059,396 401(k) accounts with balances of at least $1 million, and the average 401(k) account balance for this group was $1,263,301 according to Dashboard data.
There were 2,337,054 total retirement accounts (including employer-sponsored plans and individually controlled IRA savings and investment accounts) with balances of at least $1 million as of June 30, 2026. The average account balance for these retirement millionaires was $2,466,465 as of June 30, 2026.
How well are your investments performing?
Analyze your portfolio in minutes and receive a target allocation for your goals.
Change in average balances – accounts with at least $1 million
| June 2026 | June 2025 | Year/year change |
Average 401(k) balances | $1,263,301 | $1,225,406 | +3.1% |
Average retirement balances | $2,466,465 | $2,348,662 | +5.0% |
*Anonymized user data from the Empower Personal Dashboard™ as of June 30, 2026.
Average 401(k) balances overall reached $351,242 as of June 30, 2026, up 11.2% year over year. Retirement balances overall also increased 14.3% to $561,133 for the same period.
Change in average balances overall
| June 2026 | June 2025 | Year/year change |
Average 401(k) balances | $351,242 | $315,820 | +11.2% |
Average retirement balances | $561,133 | $491,022 | +14.3% |
*Anonymized user data from the Empower Personal Dashboard as of June 30, 2026.
Dashboard data shows that people are reaching the million-dollar retirement milestone in their 50s, with average balances of $1,073,368 as of June 30, 2026.
Average balances by age
Age by decade | Avg. retirement June 2026 | Avg. retirement June 2025 | Avg. 401(k) | Avg. 401(k) |
20s | $144,261 | $115,162 | $125,180 | $97,440 |
30s | $286,205 | $249,774 | $223,429 | $193,895 |
40s | $610,439 | $545,424 | $425,142 | $392,026 |
50s | $1,073,368 | $970,570 | $642,696 | $607,055 |
60s | $1,244,050 | $1,148,441 | $582,546 | $568,040 |
70s | $1,067,947 | $994,140 | $439,604 | $420,975 |
80s | $840,800 | $787,424 | $422,319 | $413,614 |
*Anonymized user data from the Empower Personal Dashboard as of June 30, 2026.
Dashboard data shows an uptick in average 401(k) and overall retirement savings across every decade from June 2025 to June 2026.
Still, these big savers are both spenders and carry debt, too. Among individuals with an average net worth of over $1 million, average credit card balances are around $7,806 as of June 30, 2026, according to Empower data. Some of the biggest average monthly expenditures for that same group for June 2026 include $4,450 on mortgages, $1,444 on travel, $1,361 on toys and equipment for children, $1,136 on general merchandise, $1,070 on restaurants, $709 on groceries, and $688 on clothing for the same period.
Read more: Top benefits of a 401(k) plan: Start saving early
Getting an early start
So, what does it take to achieve this retirement millionaire milestone? A look at the numbers — and behaviors — could offer some valuable insights.
Hitting the million-dollar threshold takes time and dashboard data shows people are prioritizing saving for retirement by starting early and saving continuously. In fact, the average retirement balance for people in their 20s is $144,261, and almost double that ($286,205) for those in their 30s as of June 30, 2026. This could indicate that while younger Americans may have liabilities like student loans, they are still committed to saving for retirement.
Read more: Understanding compound interest and its power
Not surprisingly, average overall retirement balances tend to increase steadily over time as earning potential rises, and up until they hit average retirement age when people start leaving the workforce and earnings years wind down. Dashboard data shows the average 401(k) balance of $642,696 for people in their 50s levels off and starts to dip to $582,546 when they reach their 60s.
While “consistently” and “as much as possible” may be good rules of thumb for saving, keep in mind there are contribution limits for 401(k)s: $24,500 in 2026 — and an additional $8,000 in catch-up contributions for those age 50 or older and $11,250 for people ages 60-63.
Read more: What are catch-up contributions?
Taking advantage of matching contributions
Employers may offer a 401(k) matching program, where they match a portion of an employee’s contribution. This can have a powerful compounded effect over time — especially considering the opportunity to invest the funds for more potential growth. It’s critical, though, to pay attention to the required contribution amounts to get the full match — otherwise it’s essentially like leaving money on the table.
Read more: What is 401(k) matching and how does it work?
Diversifying across asset classes
Investing behaviors and the ability to grow wealth over time are also important functions of working to attain the retirement millionaire distinction. According to Dashboard data, average retirement savings overall increases by more than 98% from 20s to 30s, and over 113% from 30s to 40s. The decade from 40s to 50s represents another significant growth span: Average balances rise nearly 76% during this period to surpass the $1 million milestone.
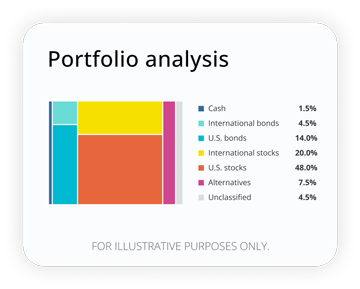
What do these investment portfolios have in common? According to Dashboard data, people with an average overall net worth of more than $1 million tend to invest in a mix across the main asset classes.*
Asset allocation for dashboard users with average net worth balances >$1 million
Age by decade | Cash | U.S. stocks | U.S. bonds | Int’l stocks | Int’l bonds | Alter-natives | Other |
20s | 16.4% | 53.4% | 2.3% | 9.9% | 0.4% | 2.4% | 15.2% |
30s | 15.4% | 51.0% | 3.3% | 10.7% | 0.6% | 2.7% | 16.4% |
40s | 15.0% | 48.3% | 5.0% | 10.9% | 0.9% | 2.9% | 17.1% |
50s | 15.2% | 45.7% | 8.7% | 10.9% | 1.6% | 3.3% | 14.6% |
60s | 16.6% | 43.3% | 12.6% | 10.7% | 2.3% | 3.7% | 10.9% |
70s | 20.2% | 42.5% | 12.9% | 9.3% | 2.2% | 3.5% | 9.3% |
80s | 25.4% | 42.2% | 11.9% | 7.4% | 2.0% | 3.2% | 7.9% |
FOR ILLUSTRATIVE PURPOSES ONLY: *Anonymized user data from the Empower Personal Dashboard as of June 30, 2026. User experiences may vary. This is not investment advice.**
Investors are most heavily weighted in U.S. stocks across decades, with those in their 20s having the highest U.S. stock holdings (53.4%). Individuals in their 40s have the lowest cash holdings (15.0%) among generations. Investing in U.S. stocks generally drops slightly by decade, offset by a gradual uptick in U.S. bond investing — with the most notable increase happening for people age 60 and over, suggesting a slightly more conservative investing approach among older generations.
Read more: What is the average asset allocation by age?
The big picture
Using online tools like the Empower Retirement Planner can help with setting retirement goals and developing strategies that align with these objectives along the way in order to maximize retirement savings.
*Asset allocation and/or diversification does not ensure a profit or protect against loss.
** Investing involves risk, including possible loss of principal. Bond prices generally fall when interest rates rise (and vice versa) and are subject to risks, including changes in credit quality, market valuations, inflation, liquidity, and default. Foreign securities involve risks, such as currency fluctuations, economic changes, and political developments. These risks may be heightened in emerging markets, which may also experience liquidity risk. Alternative investments generally invest in non-traditional asset categories or use non-conventional strategies and may have more risk than traditional investments.
RO5765166-0726


The Currency editors
Staff contributors
The CurrencyTM writers and editors cover the latest financial news and insights shaping how we live, work, and play. The team provides accurate, data-driven, and timely content aimed at empowering financial freedom for all.
The content contained in this blog post is intended for general informational purposes only and is not meant to constitute legal, tax, accounting or investment advice. You should consult a qualified legal or tax professional regarding your specific situation. No part of this blog, nor the links contained therein is a solicitation or offer to sell securities. Compensation for freelance contributions not to exceed $1,250. Third-party data is obtained from sources believed to be reliable; however, Empower cannot guarantee the accuracy, timeliness, completeness or fitness of this data for any particular purpose. Third-party links are provided solely as a convenience and do not imply an affiliation, endorsement or approval by Empower of the contents on such third-party websites. This article is based on current events, research, and developments at the time of publication, which may change over time.
Certain sections of this blog may contain forward-looking statements that are based on our reasonable expectations, estimates, projections and assumptions. Past performance is not a guarantee of future return, nor is it indicative of future performance. Investing involves risk. The value of your investment will fluctuate and you may lose money.
Certified Financial Planner Board of Standards Inc. (CFP Board) owns the certification marks CFP®, CERTIFIED FINANCIAL PLANNER™, CFP® (with plaque design), and CFP® (with flame design) in the U.S., which it authorizes use of by individuals who successfully complete CFP Board's initial and ongoing certification requirements.