Personal Strategy®
Portfolio management & financial planning for life
Portfolio management & financial planning for life
Get guidance to help you make smart financial decisions from today to retirement.


Empower lives up to its name: Our wealth management consultant empowers us to make the right decisions that move us towards our goals. They always have our best interest in mind, and have simplified retirement planning and achieving our financial goals.
Matthew H.
Unpaid Empower Advisory Group, LLC (EAG) client testimonial*
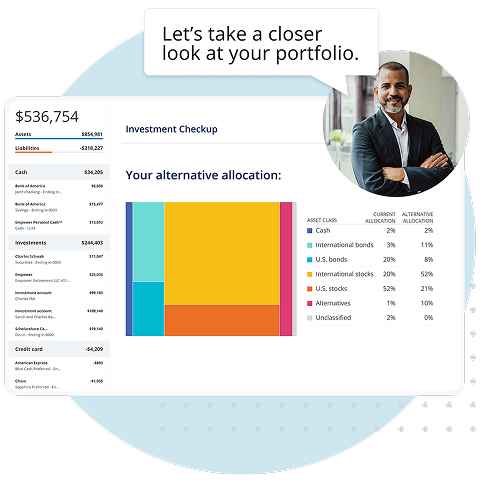
Your financial strategy & nobody else’s
Proactive planning, dedicated guidance, and tools to help you invest well and live a little.
-

Responsive advisors
Accessible and attentive — your team is here when you need them.
-

Ongoing financial planning
Guidance from financial planning specialists helps refine your strategy.
-

Unbiased advice
Your success is our priority. We work for you.
-

Innovative technology
Clearly see how today’s decisions could impact your financial future.
Tell us where you want to go
If you have $100,000 or more in investable assets, it may be time to consider wealth management. That’s where we come in.

Personalized portfolio design
Experience a tailored investing strategy that adjusts with your changing needs.
Unique diversification method
Designed to help manage risk and support growth, our Smart Weighting™ approach helps keep your portfolio balanced.
Daily portfolio monitoring
Financial professionals + advanced technology monitor your account for rebalancing opportunities.
Flexible investing choices
Customize your portfolio with options that reflect what’s important to you.
Tax guidance and filing, together at last
Finally, a total tax solution, directly from your Empower Personal DashboardTM.
-

Personalized tax report when you invest $250K
Get a clear picture of your tax situation for smarter tax planning.
-

Professional tax filing support at your fingertips
Get matched with a Tax Pro1 from your Empower Personal Dashboard.
Smarter strategies for reducing taxes
Smart tax tools built for every stage to help you keep more of what you earn, no matter where you start.
Maximizing tax efficiency
Your advisor will help you to construct a tax-efficient portfolio that works for you.
Intelligent asset location
We optimize where your assets do their best work: from taxable to tax-deferred or tax-free accounts.
Tax-loss harvesting with precision
We strategically sell investments to help you keep more of what you earn.
Track everything in your dashboard
Keep tabs on your portfolio, trades, performance, income, balances, and projections, all in one place.
Coaching to help you stay on course
Learn how to navigate emotional or complex decisions, which may help improve long-term financial outcomes.2
Transparent advisory fee
We charge an annual advisory fee as a percentage of your total assets under management (AUM), using a tiered fee structure. No hidden fees, no trailing fees, and no trade commissions. Your “all-in” cost is a combination of our advisory fee and any ETF expense ratios.3
| Assets | Annual advisory fee |
|---|---|
| INVESTMENT SERVICES CLIENTS | |
| $100,000-$249,999 | 0.89% |
| WEALTH MANAGEMENT CLIENTS | |
| $250,000-$999,999 | 0.89% |
| PRIVATE CLIENTS | |
| First $3M | 0.79% |
| Next $2M ($3,000,001 - $5M) | 0.69% |
| Next $5M ($5,000,001 - $10M) | 0.59% |
| Amount over $10M | 0.49% |
| Family tiered billing4 | 0.79% |
Compare our wealth management services
|
Financial advisor |
|
Tax optimization 
|
|
Disciplined rebalancing
|
|
Dynamic portfolio allocation
|
|
Education & college planning
|
|
Tax planning 
|
|
Private banking services
|
|
Private equity access5
|
|
Estate planning
|

Value you can see
Enhance your annual return and capture savings with tax-smart strategies, coaching, and financial planning included.
Let's talk
Meet with an advisor for an in-depth financial review. From the first conversation, our focus is on you and your goals.


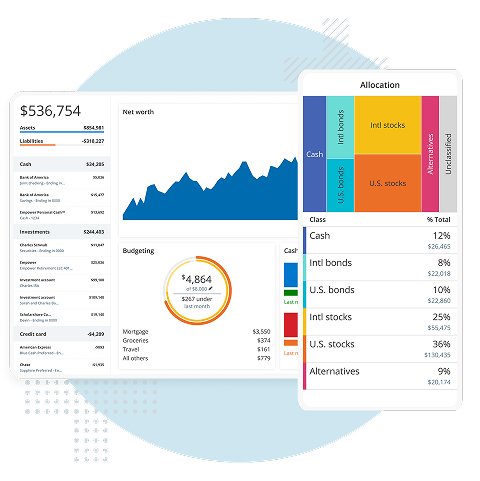
Getting good at money starts when you see the full picture
Connect your accounts to see your investments, cash, credit, and more in one place. We offer leading security measures like encryption, multifactor authentication, and fraud protection to keep your data safe.