
The average 401(k) balance by age
The average 401(k) balance by age
According to Empower data, the average 401(k) balance is $351,242, but differs significantly by age. See how your savings stack up
The average 401(k) balance by age
According to Empower data, the average 401(k) balance is $351,242, but differs significantly by age. See how your savings stack up

Paul Deer, CFP®
07.09.2026
Key takeaways
- The average 401(k) balance for those in their 20s is $125,180, while those in their 50s have the highest average 401(k) balance at $642,696.
- Comparing average 401(k) benchmarks can help you see how your savings compare to others your age, but every financial situation is unique.
- Saving early and often can help you maximize the potential for compounding earnings over time.
One of the most common investment vehicles that Americans use to save for retirement is an employer-sponsored the 401(k), which allows you to save for retirement in a tax-deferred way. An Empower analysis of anonymized 401(k) data shows the overall average balance at $351,242, with people in their 50s holding the highest average at $642,696.
If your employer offers a 401(k) and you are not utilizing it, you may be leaving money on the table — especially if your employer matches your contributions. In 2026, you can contribute up to $24,500.
The 401(k) is one of the top retirement saving options for many people. Empower data shows that the majority of Americans contribute to a retirement plan (70%), though contributions vary by generation.
How much do people actually have saved in their 401(k) plans? And how does this stack up against what they could have saved if they were maxing out their 401(k) every year?
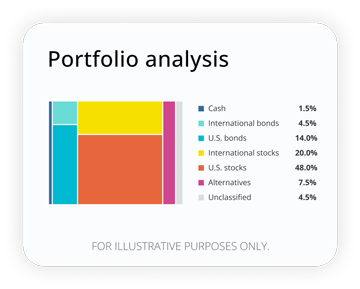
How well are your investments performing?
Analyze your portfolio in minutes and receive a target allocation for your goals.
The average 401(k) balance by age
According to Empower data, the average 401(k) balance across all age groups is $351,242. Take a look at this chart showing how the average 401(k) balance differs by age.
Age | Average 401(k) | Median 401(k) |
20s | $125,180 | $44,627 |
30s | $223,429 | $81,314 |
40s | $425,142 | $160,899 |
50s | $642,696 | $252,501 |
60s | $582,546 | $191,372 |
70s | $439,604 | $98,076 |
80s | $422,319 | $76,609 |
Anonymized data from Empower Personal DashboardTM as of June 2026.
These figures include 401(k) balance data from people who use Empower’s online financial dashboard and may include balances from both current and former employer-sponsored plans. Investors who use online financial tools tend to be particularly engaged in saving for retirement and other financial best practices. An Empower study shows 30% of adults say building up a retirement plan savings like 401(k) investments is key to achieving financial success.
Average 401(k) balance for 20s – $125,180; median – $44,627
When you’re in your 20s, if you’ve paid down any high-interest debt, consider saving as much as you can into your 401(k) and other retirement accounts. The earlier you start, the better it can be. As you can see from the potential savings chart below, compounding earnings is no joke.
Average 401(k) balance for 30s – $223,429; median $81,314
Your 30s can be a good time to aggressively pay down any non-mortgage debt. If you still have high-interest debt, you potentially may be earning up to 8% in your retirement account but may be paying 20% or more in credit card interest.
Average 401(k) balance for 40s – $425,142; median $160,899
If you haven’t already started to max out your 401(k) annually by this age, then you may want to start thinking about what changes you can make to get as close as possible to that $24,500 per-year contribution. You don’t want to lose out on years of potential compounding growth.
Average 401(k) balance for 50s – $642,696; median $252,501
When you hit your 50s, you become eligible to make larger contributions toward your retirement accounts. These are called catch-up contributions. Consider taking advantage of them. Catch-up contributions are $8,000 in 2026. So, if you contribute the annual limit of $24,500 plus your catch-up contribution of $8,000, that’s a total of $32,500 tax-deferred dollars you could be saving towards your retirement. (A temporary “super catch-up” of $11,250 is also available for people ages 60–63.)
Average 401(k) balance for 60s – $582,546; median – $191,372
By your early 60s, you should have a better idea of what retirement could look like for you and what it really means for you to be “retired.” Do you want to keep working as long as you can? Would you like to slow down? What are your Social Security benefits and when is the optimal age to start taking them? Are you eligible for spousal or survivor benefits?
Average 401(k) balance for 70s – $439,604; median – $98,076
The average age to retire is 65 for men and 63 for women, so it’s not surprising to see the average and median 401(k) balance figures start to decline in people's 70s as people start withdrawing from their accounts. Once you reach age 65, there are still several considerations for your retirement, even if you are no longer working and accumulating wealth. Some of these include making decisions about Medicare, creating a plan around withdrawing money from your retirement accounts, and evaluating any additional insurance needs.
Read more: Average retirement savings by age
401(k) savings potential by age
The following chart depicts 401(k) savings potential by age, based on several assumptions. This is how much you could have saved to help you replace your income in retirement. The chart below is based on the following assumptions:
- You start full-time employment at age 22.
- Your starting salary is $70,000 (around the current U.S. national average wage of 69,846.57) and increases by 3% each year.1
- You contribute 15% of your salary to a 401(k), capped at $24,500 annually.
- Your employer provides a 50% match on the first 5% of your salary.
- Total annual contributions (employee + employer) are capped at $72,000.
- Contributions continue consistently each year through age 65.
- The “No growth” column reflects cumulative employee contributions only, with no investment returns.
- The “Employer match” column shows annual employer contributions based on the match formula.
- The “8% growth” column assumes an 8% annual return, compounded yearly, on both employee and employer contributions.
- No withdrawals, fees, or catch-up contributions are included in the model.
Age | Annual salary | Annual | Employer match | No growth | 8% growth |
22 | $70,000.00 | $10,500.00 | $1,750.00 | $10,500.00 | $12,250.00 |
23 | $72,100.00 | $10,815.00 | $1,802.50 | $21,315.00 | $25,847.50 |
24 | $74,263.00 | $11,139.45 | $1,856.58 | $32,454.45 | $40,911.32 |
25 | $76,490.89 | $11,473.63 | $1,912.27 | $43,928.08 | $57,570.14 |
26 | $78,785.62 | $11,817.84 | $1,969.64 | $55,745.93 | $75,963.23 |
27 | $81,149.19 | $12,172.38 | $2,028.73 | $67,918.30 | $96,241.40 |
28 | $83,583.66 | $12,537.55 | $2,089.59 | $80,455.85 | $118,567.85 |
29 | $86,091.17 | $12,913.68 | $2,152.28 | $93,369.53 | $143,119.23 |
30 | $88,673.91 | $13,301.09 | $2,216.85 | $106,670.61 | $170,086.70 |
31 | $91,334.12 | $13,700.12 | $2,283.35 | $120,370.73 | $199,677.11 |
32 | $94,074.15 | $14,111.12 | $2,351.85 | $134,481.85 | $232,114.26 |
33 | $96,896.37 | $14,534.46 | $2,422.41 | $149,016.31 | $267,640.26 |
34 | $99,803.26 | $14,970.49 | $2,495.08 | $163,986.80 | $306,517.05 |
35 | $102,797.36 | $15,419.60 | $2,569.93 | $179,406.40 | $349,027.96 |
36 | $105,881.28 | $15,882.19 | $2,647.03 | $195,288.60 | $395,479.42 |
37 | $109,057.72 | $16,358.66 | $2,726.44 | $211,647.25 | $446,202.87 |
38 | $112,329.45 | $16,849.42 | $2,808.24 | $228,496.67 | $501,556.75 |
39 | $115,699.33 | $17,354.90 | $2,892.48 | $245,851.57 | $561,928.68 |
40 | $119,170.31 | $17,875.55 | $2,979.26 | $263,727.12 | $627,737.78 |
41 | $122,745.42 | $18,411.81 | $3,068.64 | $282,138.93 | $699,437.25 |
42 | $126,427.79 | $18,964.17 | $3,160.69 | $301,103.10 | $777,517.09 |
43 | $130,220.62 | $19,533.09 | $3,255.52 | $320,636.19 | $862,507.07 |
44 | $134,127.24 | $20,119.09 | $3,353.18 | $340,755.28 | $954,979.90 |
45 | $138,151.06 | $20,722.66 | $3,453.78 | $361,477.94 | $1,055,554.72 |
46 | $142,295.59 | $21,344.34 | $3,557.39 | $382,822.28 | $1,164,900.83 |
47 | $146,564.46 | $21,984.67 | $3,664.11 | $404,806.94 | $1,283,741.68 |
48 | $150,961.39 | $22,644.21 | $3,774.03 | $427,451.15 | $1,412,859.25 |
49 | $155,490.23 | $23,323.53 | $3,887.26 | $450,774.69 | $1,553,098.78 |
50 | $160,154.94 | $24,023.24 | $4,003.87 | $474,797.93 | $1,705,373.80 |
55 | $185,663.47 | $24,500.00 | $4,641.59 | $597,297.93 | $2,675,058.52 |
60 | $215,234.84 | $24,500.00 | $5,380.87 | $719,797.93 | $4,103,916.65 |
65 | $249,516.17 | $24,500.00 | $6,237.90 | $842,297.93 | $6,208,099.91 |
*FOR ILLUSTRATIVE PURPOSES ONLY. This hypothetical illustration does not reflect a particular investment and is not a guarantee of future results. It assumes an 8% annual rate of return, reinvestment of earnings and no withdrawals. Rates of return may vary. The illustration does not reflect fees, which could change the outcomes provided.
Read more: The average net worth by age in America
5 steps to take now to help improve your retirement readiness
While the average 401(k) balance for people in their 50s at pre-retirement age is around $642,696, it’s also probably not enough to retire comfortably for most people. For expenses alone, the average American household spends $77,280 each year.
Needless to say, many people may be falling below their savings potential. But the good news is it’s not too late to turn things around.
1. Save early, often and aggressively.
Saving can be hard when you are young and not making a large salary, and it’s hard when you’re older and big life expenses get in the way. However, the biggest threat to your retirement is inaction. Even if it’s uncomfortable to max out your 401(k), do it if you can. If you get a salary raise, consider putting 50% of it toward savings if you’re able. The earlier you can save, the better off you may be, and you may even surprise yourself with how much you are able to put away. Compounding can do wonders when there is a positive annual return — as you can see from the high end of the potential savings chart — so the earlier you can save more, the farther your money may go.
2. Don’t rely only on Social Security.
With nearly half of Americans (45%) saying they retired or plan to retire between the ages of 60 and 69, it’s crucial to save in other investment vehicles, such as a 401(k), in order to maintain your desired lifestyle in retirement.
According to the United States Social Security Administration, Social Security combined Old-Age and Survivors Insurance and Disability Insurance (OASI and DI) Trust Funds are expected to be depleted by 2034, at which point a portion of the benefits will be paid from ongoing tax revenue.2 Nearly three in four Americans rely or expect to rely on Social Security benefits for retirement income, according to Empower research.
3. Have a realistic understanding of when you want to retire.
Having clearly defined personal goals will help you determine how much you should have saved. Your savings objectives will be different if you plan to retire at 50 than if you plan to continue working past 70.
Additionally, it’s important to determine as accurately as you can what your cost of living will be in retirement. How much do you need to spend per year to maintain the lifestyle that you want for the rest of your life? Have a good sense of what your costs will be so you can factor that into your overall retirement strategy. Really evaluate how long you want to continue working, and what retirement age is realistic for you based on your income and your current level of savings.
4. Develop other sources of income.
Think about other ways you can secure sources of income in retirement outside of collecting Social Security and withdrawing from your 401(k). This will not only prevent you from having all your retirement eggs in one basket, but it is also something to consider if your 401(k) balance is lower than you’d like. Where can you invest, and how can you optimize your portfolio for potentially greater returns? Consider other ways you can supplement your retirement income and consider speaking to a financial advisor about what solutions could work for you.
5. Leverage all the resources at your disposal.
There are many tools available to help you understand your financial life in more detail. Not leveraging them can result in a huge blind spot when it comes to your finances. Simply having this information will help you understand if you are on the right track, and how to help accelerate your progress on your retirement goals. If working with a financial professional is an option for you, this can be an invaluable resource, especially as you get closer to retirement.
A financial professional who has your best interest in mind can help you strategize and address potential gaps in your savings and retirement income plans.
The bottom line
Having a good understanding of where you are spending and saving, and having a holistic sense of your lifestyle costs, is crucial to your overall retirement planning objectives. The point of this savings potential chart is not to discourage you if you do not fall somewhere in the defined 401(k) balance range; it is more to show you what is possible.
Yes, consider maxing out your 401(k) if that's right for you. Beyond that, try to save in other ways as well. Even if you don’t think that’s possible for you, striving towards these goals and contributing as much as possible may get you closer to your targets than if you were to contribute very little or nothing at all.
1 Social Security Administration, “National Average Wage Index,” accessed July 2026.
2 Social Security Administration, ”Social Security Board of Trustees: Projection for Combined Trust Funds Remains Consistent with Prior Year,” June 9, 2026.
RO5731466-0726
 Be current.
Get insights and intel on your money.
*If you’re already registered with Empower, please use the same email address as your existing account.

Paul Deer, CFP®
Contributor
Paul Deer is the Vice President of Wealth Private Client at Empower. A CERTIFIED FINANCIAL PLANNER™ professional, he has over a decade of industry experience, and leads a team of financial advisors serving Empower clients.
The content contained in this blog post is intended for general informational purposes only and is not meant to constitute legal, tax, accounting or investment advice. You should consult a qualified legal or tax professional regarding your specific situation. No part of this blog, nor the links contained therein is a solicitation or offer to sell securities. Compensation for freelance contributions not to exceed $1,250. Third-party data is obtained from sources believed to be reliable; however, Empower cannot guarantee the accuracy, timeliness, completeness or fitness of this data for any particular purpose. Third-party links are provided solely as a convenience and do not imply an affiliation, endorsement or approval by Empower of the contents on such third-party websites. This article is based on current events, research, and developments at the time of publication, which may change over time.
Certain sections of this blog may contain forward-looking statements that are based on our reasonable expectations, estimates, projections and assumptions. Past performance is not a guarantee of future return, nor is it indicative of future performance. Investing involves risk. The value of your investment will fluctuate and you may lose money.
Certified Financial Planner Board of Standards Inc. (CFP Board) owns the certification marks CFP®, CERTIFIED FINANCIAL PLANNER™, CFP® (with plaque design), and CFP® (with flame design) in the U.S., which it authorizes use of by individuals who successfully complete CFP Board's initial and ongoing certification requirements.