
Q3 2025 Wealth Watch Report: Retirement balances grow 4.5% from Q2
Q3 2025 Wealth Watch: Retirement balances grow 4.5% from Q2
Empower Personal DashboardTM data reveals average retirement account balances climbed 4.5% from Q2 2025 to Q3 2025
Q3 2025 Wealth Watch: Retirement balances grow 4.5% from Q2
Empower Personal DashboardTM data reveals average retirement account balances climbed 4.5% from Q2 2025 to Q3 2025

12.22.2025

Listen
·Q3 2025 Wealth Watch: Retirement balances grow 4.5% from Q2
Key takeaways
- Retirement savers made notable gains in Q3, with Roth IRAs showing the largest relative increase of 6.6% compared to Q2.
- Net worth continued to edge higher across generations, as Gen Z (+7.5%) and Millennials (+8.1%) clocked the greatest gains quarter over quarter.
- All four major U.S. stock indices hit record highs, with the Russell 2000 leading gains at 12%.
The Currency’s quarterly Wealth Watch report tracks the distribution of American wealth against the backdrop of saving trends, investing patterns, and financial market conditions.
Retirement savers boost account balances
Average retirement account balances posted significant gains in Q3 as savings increased across all major account types, according to Empower Personal DashboardTM data. Retirement account balances averaged $491,022 in June, Q2 rising to $513,054 in September, Q3.
The average 401(k) climbed to $329,915 in September, while 403(b) plans reached $139,750 — a sign of consistent contributions and steady growth. IRAs hit a record high of $277,483, up 7.5% from a year ago.* Roth IRAs also grew, averaging $98,697 — an 8.6% gain year over year.
Account type | Q3 2025 | Q2 2025 | Change vs Q2 2025 | Q3 2024 | Change vs Q3 2024 |
401(k) | $329,915 | $315,820 | +4.5% | $312,194 | +5.7% |
IRA | $277,483 | $266,953 | +3.9% | $258,178 | +7.5% |
Roth IRA | $98,697 | $92,619 | +6.6% | $90,862 | +8.6% |
403(b) | $139,750 | $133,562 | +4.6% | $128,861 | +8.4% |
Quarterly figures reflect average values for the final month of each respective quarter (e.g., June for Q2 and September for Q3).
Net worth, notably higher
Americans’ net worth averaged $599,687 at the end of Q3 (September average), Empower Personal Dashboard data shows. Across generations, averages range from $93,138 for Gen Z to over $1.5 million for Baby Boomers. Gen Z and Millennials saw the greatest increases at 7.5% and 8.1%, respectively.
Generation | Q3 2025 | Q2 2025 | Change vs Q2 2025 |
Gen Z | $93,139 | $86,637 | +7.5% |
Millennials | $330,126 | $305,454 | +8.1% |
Gen X | $1,079,963 | $1,024,334 | +5.4% |
Baby Boomers | $1,554,643 | $1,498,976 | +3.7% |
Silent Generation | $1,318,826 | $1,294,472 | +1.9% |
Quarterly figures reflect average values for the final month of each respective quarter (e.g., June for Q2 and September for Q3).
What’s driving net worth growth?
📈 U.S. stocks delivered solid gains in Q3 2025 with equity indices reaching new heights and reflecting strong corporate earnings. Russell 2000 was the best performer of the major benchmarks, up 12%, while the S&P 500 (+7.8%) and Nasdaq Composite (+11.2%) had their strongest Q3 since 2020. The Dow Jones finished the quarter at +5%.1
🏡 Home prices continued their upward momentum in the third quarter. The median U.S. home sold for about $370,000, up 1.2% from the prior quarter, and typical sellers realized nearly 50% profit margins on home sales.2
💰 Retirement accounts (401(k), IRA, 403(b), etc.) climbed 4.5%, per Empower Personal Dashboard data, boosted by contributions and rising alongside major market indices.
💼 Privately owned companies saw healthy momentum in Q3. Private-equity investment totaled roughly $300 billion, a 14-quarter high, supporting the value of private businesses nationwide.3
💵 Cash and bank deposits continued to grow in Q3 2025, rising about 0.5% (roughly $92 billion), with interest-bearing accounts increasing and checking balances holding steady — pointing to stable household cash levels at banks.4
💳Household debt increased by $197 billion to reach $18.59 trillion in the third quarter. Credit card balances rose by $24 billion to reach $1.23 trillion, while auto loan balances held steady at $1.66 trillion.5
Inside the new wealth realities: How Americans navigate spending, investing, and budgeting
Shifting spending patterns
Americans continued to navigate rising costs in 2025, with essential expenses climbing across most major categories and discretionary spending showing pockets of strong growth. Americans’ biggest spending categories in 2025 were travel, general merchandise, and restaurants — though electronics, hobbies, and pet care saw the largest relative increases year-over-year. Essential categories — groceries, utilities, insurance, healthcare, auto costs, gas, home maintenance, and telephone — totaled roughly $4,000 per month.
Read more: What Americans spent and saved in 2025
Balancing caution and growth
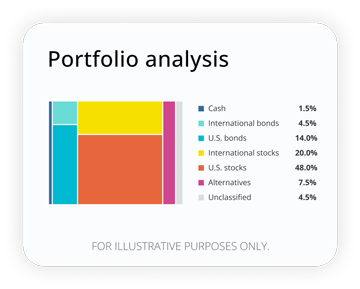
Across generations, investors are striking a balance between caution and growth. Cash plays a significant role for younger adults — those in their 20s hold more cash than any group except retirees over 70 — while investors in their 20s, 30s, and 40s show surprisingly similar portfolio patterns. These groups lean heavily toward U.S. stocks (40–43%), keep international exposure modest, and maintain minimal bond allocations of 5% or less. Together, these choices reflect a cross-generational effort to balance near-term stability with long-term growth.
Read more: Average asset allocation by age
Budgeting with ambition
Watch the pennies and the dollars will take care of themselves… Some households are rethinking what a “realistic” budget looks like — and aiming lower on purpose. A study of 350 million transactions found that people with optimistic budgets, with targets below their usual spending habits, spent around 22% less than those with no budget.
Read more: The power of ambitious budgeting
How well are your investments performing?
Analyze your portfolio in minutes and receive a target allocation for your goals.
*Per Empower Personal DashboardTM data, January 2023 to September 2025.
1 Yahoo Finance, “Here's How the S&P 500, Nasdaq, and Dow Jones Did In Q3 2025,” September 2025.
2 ATTOM, “Home Sales Profits Up in Third Quarter to Near 50 Percent Margin,” October 2025.
3 KPMG, “Q3’25 Pulse of Private Equity: United States,” October 2025.
4 FDIC, “Quarterly Banking Profile,” November 2025.
5 Federal Reserve Bank of New York, “Household Debt and Credit Report (Q3 2025),” November 2025.
RO5060578-1225


The Currency editors
Staff contributors
The CurrencyTM writers and editors cover the latest financial news and insights shaping how we live, work, and play. The team provides accurate, data-driven, and timely content aimed at empowering financial freedom for all.
The content contained in this blog post is intended for general informational purposes only and is not meant to constitute legal, tax, accounting or investment advice. You should consult a qualified legal or tax professional regarding your specific situation. No part of this blog, nor the links contained therein is a solicitation or offer to sell securities. Compensation for freelance contributions not to exceed $1,250. Third-party data is obtained from sources believed to be reliable; however, Empower cannot guarantee the accuracy, timeliness, completeness or fitness of this data for any particular purpose. Third-party links are provided solely as a convenience and do not imply an affiliation, endorsement or approval by Empower of the contents on such third-party websites. This article is based on current events, research, and developments at the time of publication, which may change over time.
Certain sections of this blog may contain forward-looking statements that are based on our reasonable expectations, estimates, projections and assumptions. Past performance is not a guarantee of future return, nor is it indicative of future performance. Investing involves risk. The value of your investment will fluctuate and you may lose money.
Certified Financial Planner Board of Standards Inc. (CFP Board) owns the certification marks CFP®, CERTIFIED FINANCIAL PLANNER™, CFP® (with plaque design), and CFP® (with flame design) in the U.S., which it authorizes use of by individuals who successfully complete CFP Board's initial and ongoing certification requirements.