
Economy: It’s an AI world
Overview I Economy I Equity market I Bond market I AI I Housing market I Global debt
U.S. economic and market outlook 2026
Economy: It’s an AI world
Despite all the tariff headlines and consumer-related fears, the 2025 economy boiled down to one dominant factor: AI
It’s a capex (capital expenditures) thing. Tech firms are on an AI bender, with the AI investment cycle inflating their infrastructure building and spurring cloud revenue.
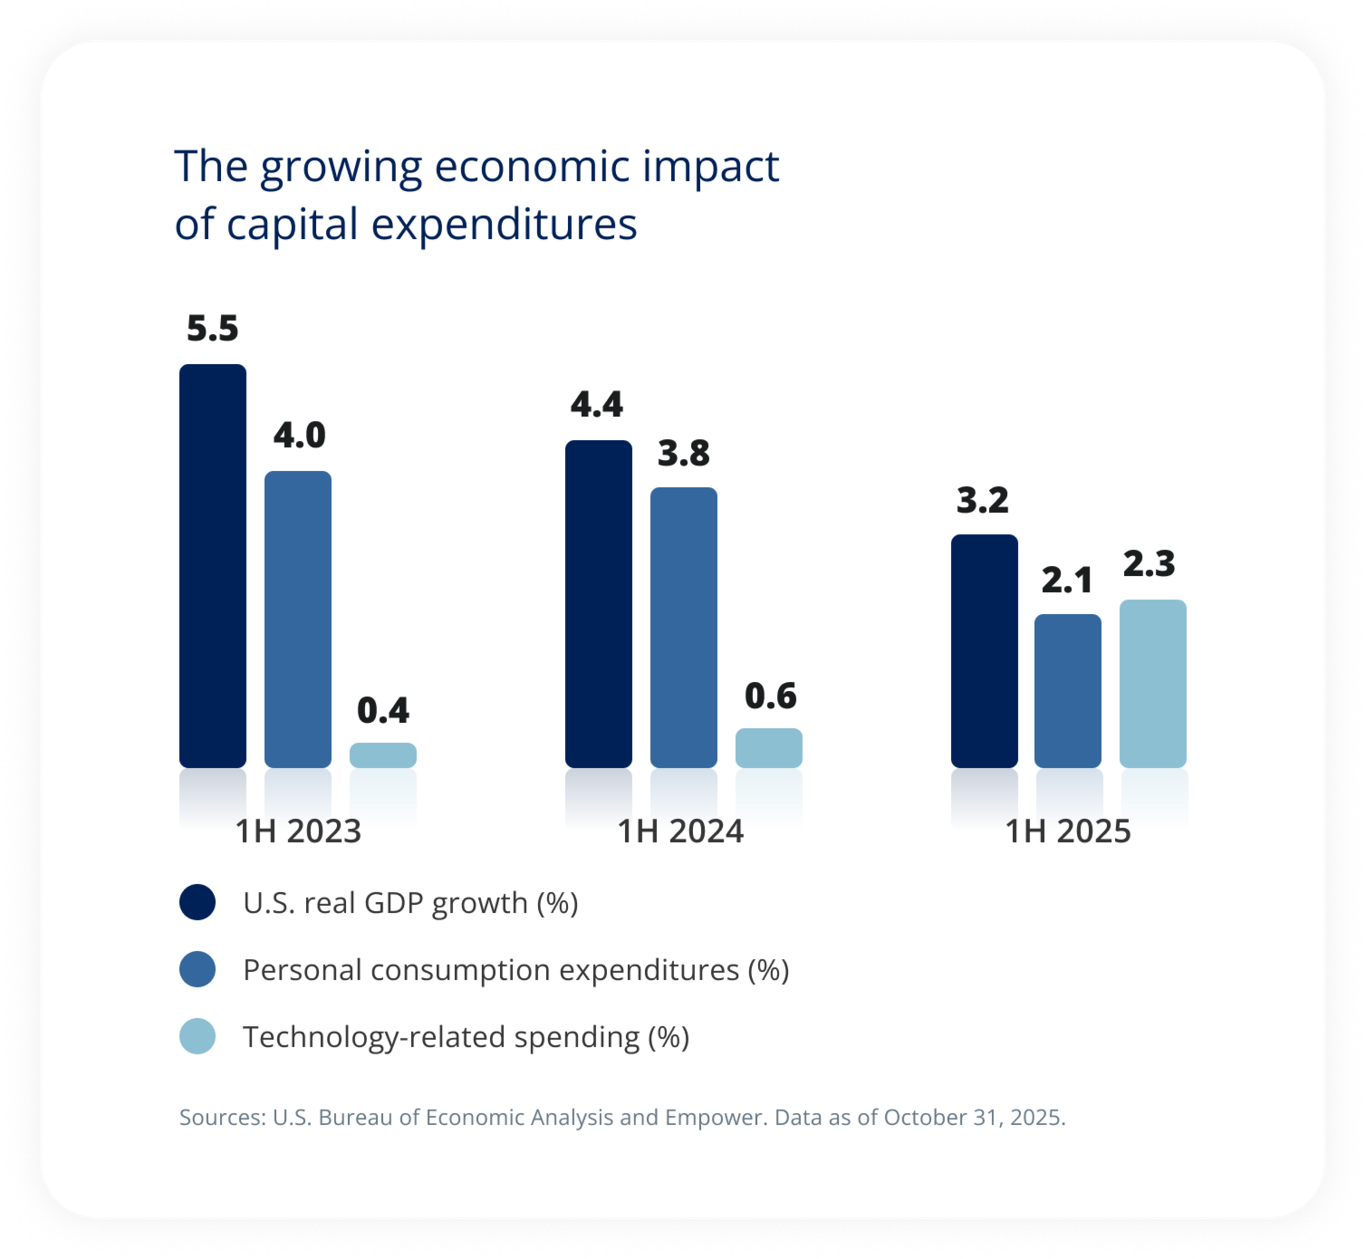
We evaluate real GDP growth in the first half of the year in 2025 against the first-half real GDP growth in 2023 and 2024. We also compare the contribution of consumer spending to the contribution of technology-related fixed investment. We find that technology-related fixed investment has increased markedly relative to prior years.
Technology-related spending is defined as the combined total of Information Processing Equipment, Software, and Research & Development excluding Software within GDP components.
We expect more of the same in 2026
In fact, our AI research suggests that related capital expenditures by hyperscalers such as Alphabet, Microsoft, Oracle, and Amazon could reach $400 billion in 2026, which would make hyperscalers as much or more central to economic strength over the next year as they have been over the past year.
That’s because AI remains capacity constrained
For companies to harvest demand — and revenue — they have to train models, build data centers, and develop energy sources.
Thus, before we can look for the revenue, we have to see even greater investment.
A capex-driven market changes the economic calculus a bit
The consumer still matters — of course — and we’ll want to keep a close eye on all the traditional consumer measures: inflation, labor, housing, and retail spending.
In particular, we’re worried by the economic splintering we’re seeing across different cuts of the economy. Consider the wealth gains since the pandemic by those who own homes, which has essentially shut out new homebuyers. Or the higher unemployment rate for younger demographics relative to the still-healthy broader labor market.
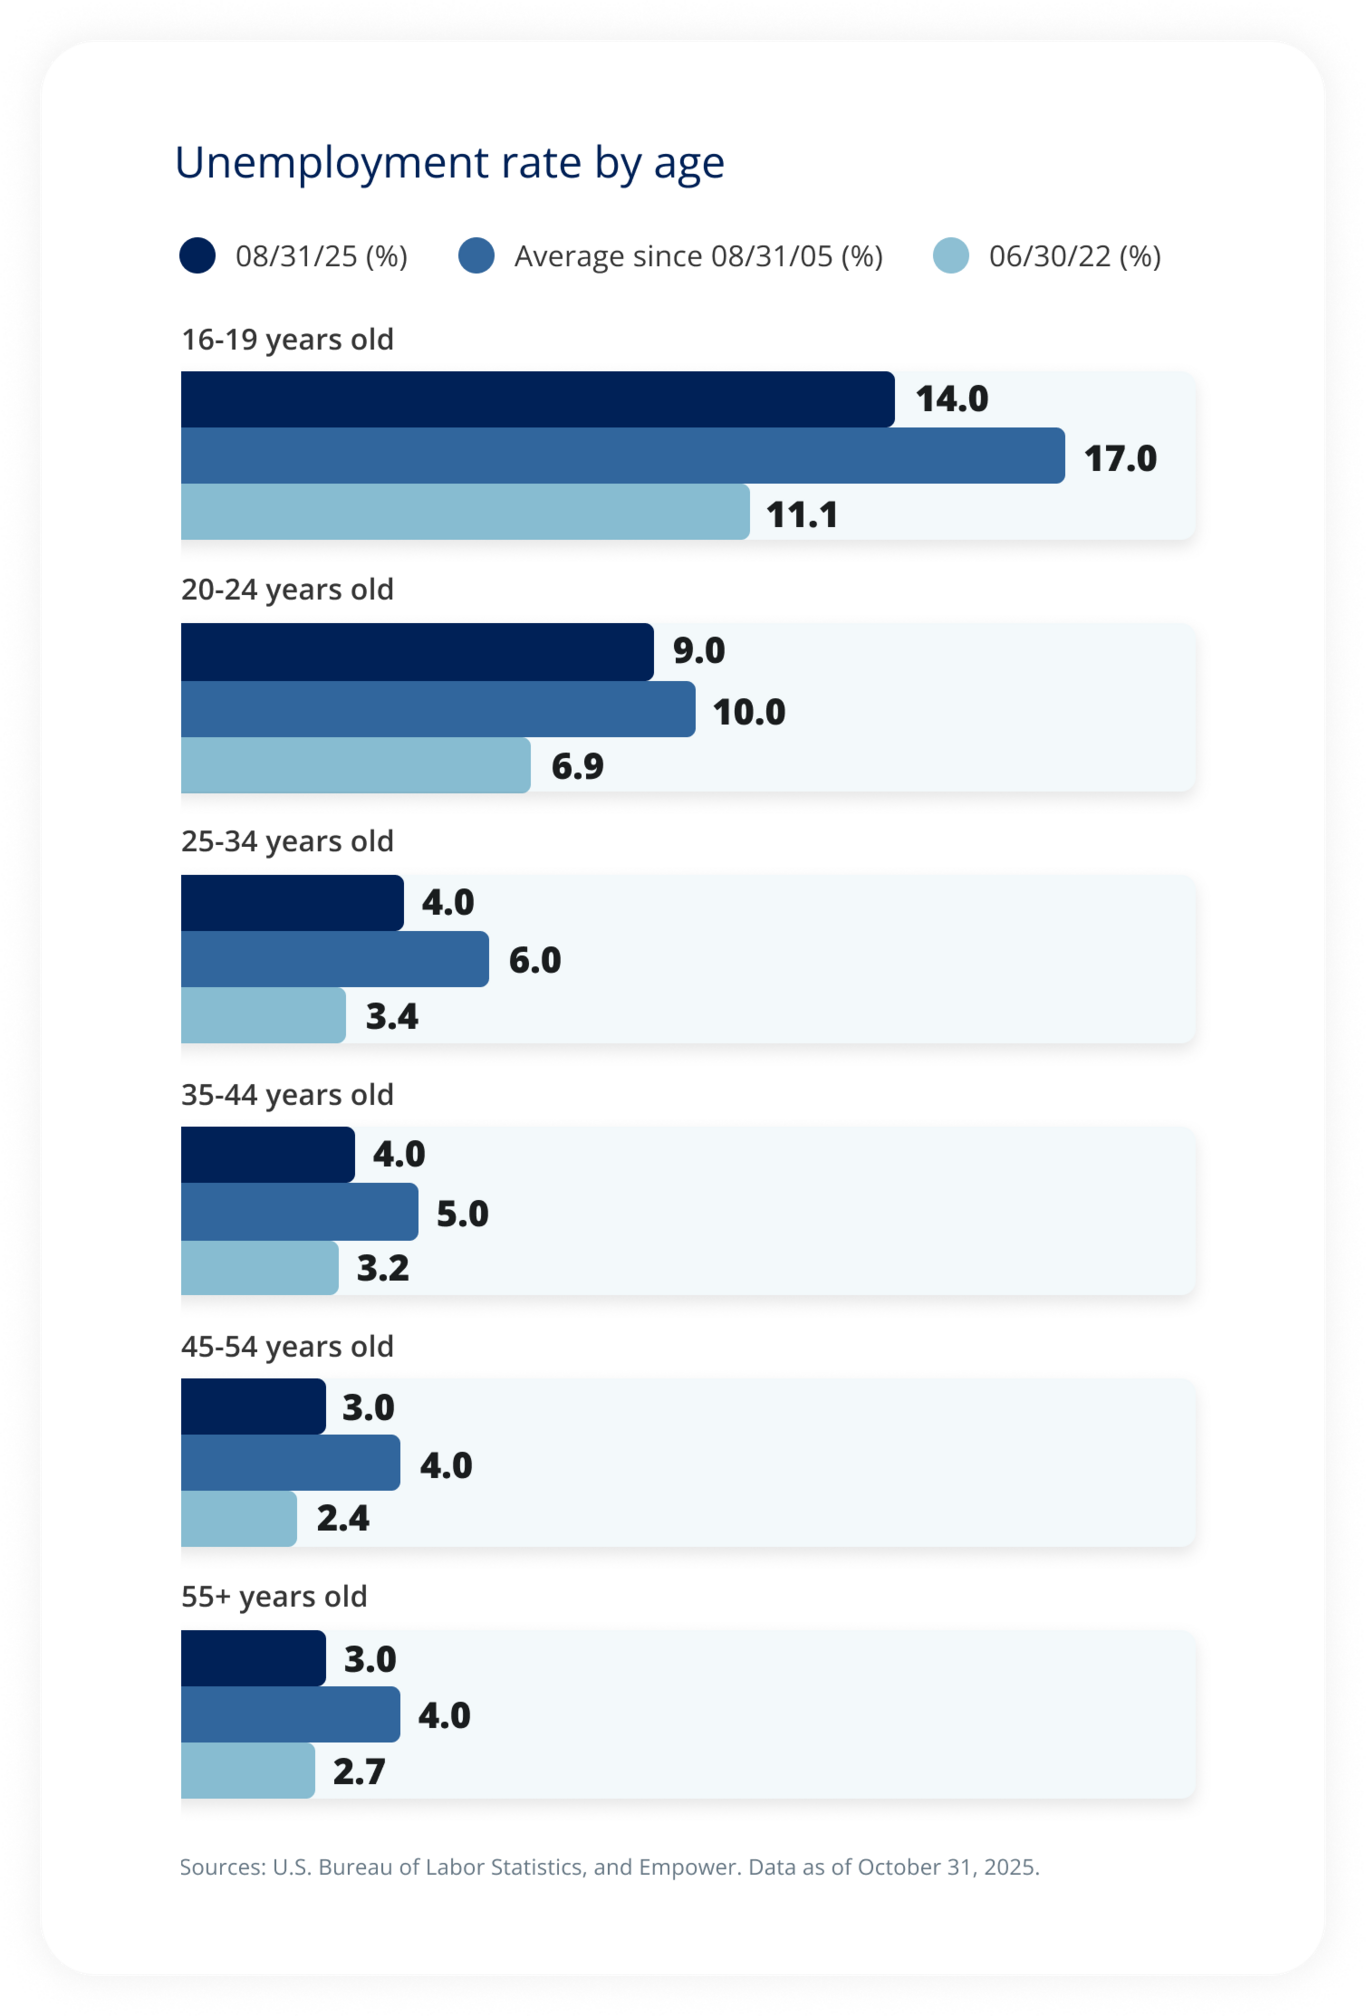
We review the unemployment rate by age. We find that while unemployment is below the 10-year average across all age categories, but that it has worsened meaningfully over the past three years, particularly for younger job seekers.
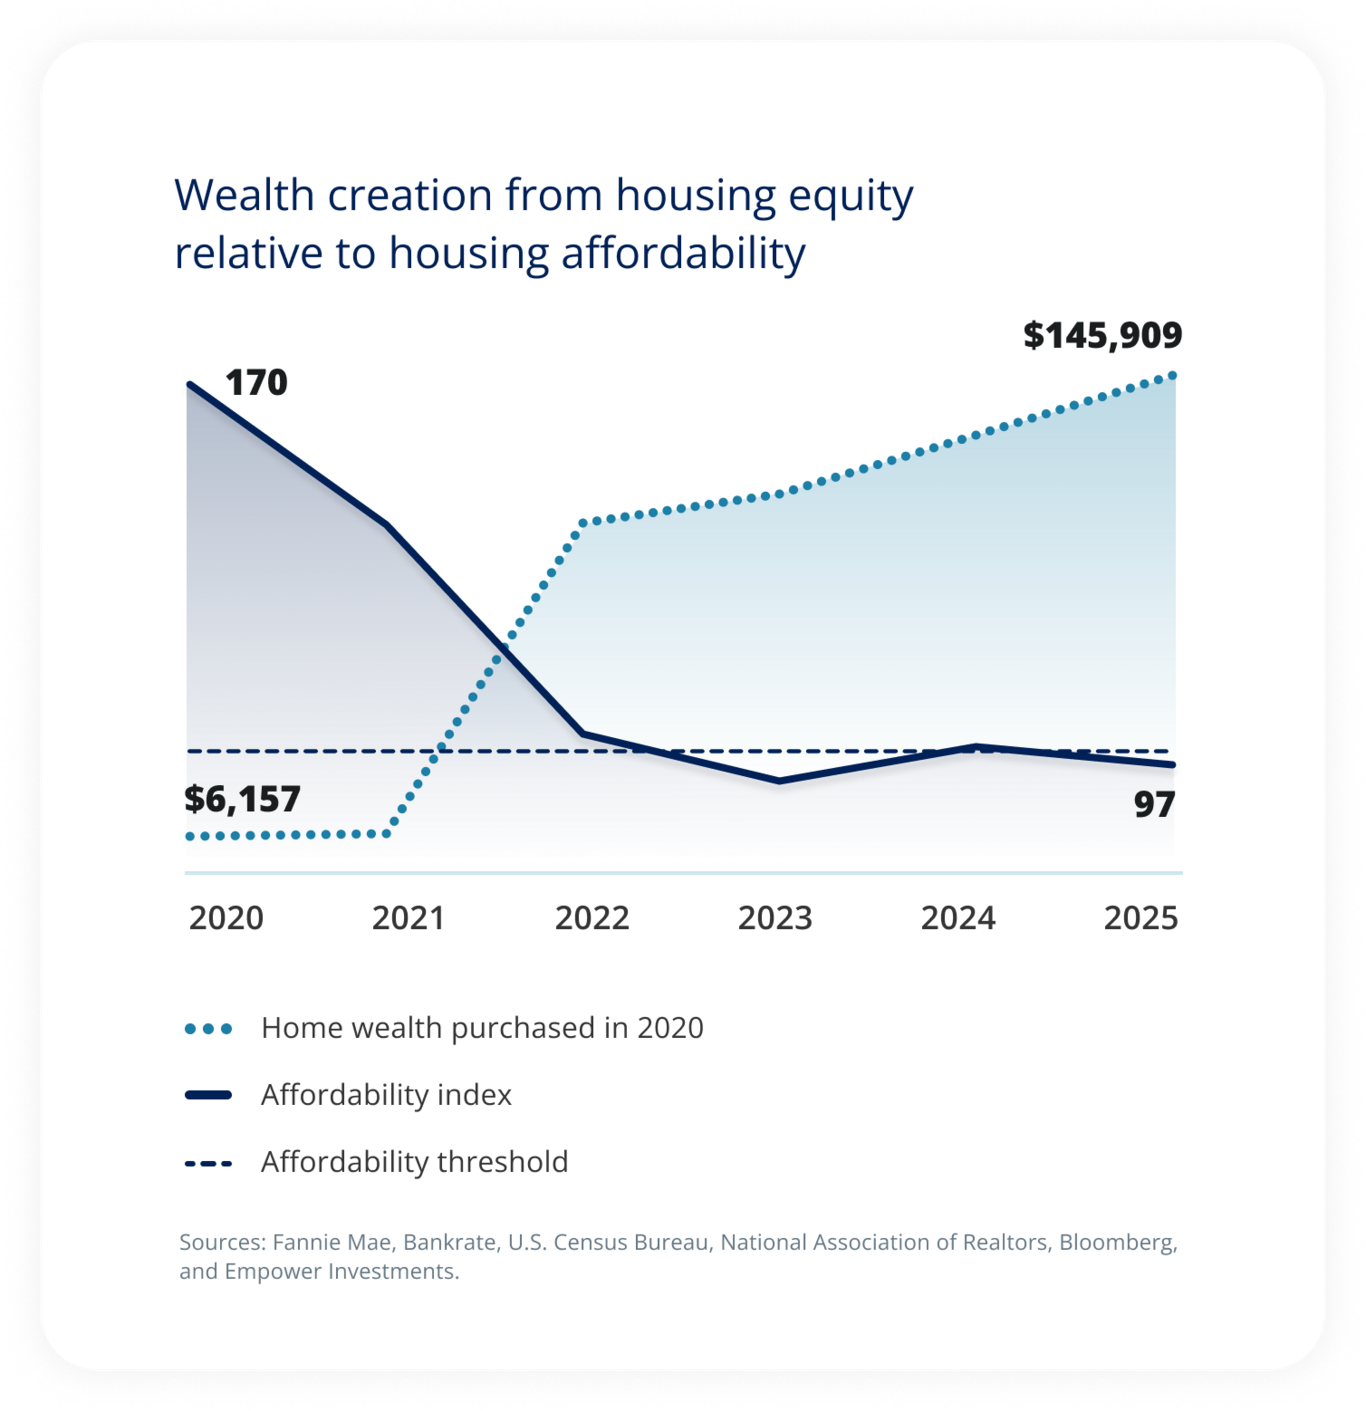
We compare the wealth creation from rising home price equity for homes purchased in 2020 relative to an index measuring affordability over the same period. The contrast is stark: Due largely to rising home prices, homeowners have seen a remarkable gain in wealth over this stretch. However, those looking to enter the market are looking at extremely low levels of affordability.
A Housing Affordability Index of 100 indicates that a median-income household earns exactly enough to afford a median-priced home under standard mortgage terms. Values above 100 imply greater affordability, while values below 100 indicate that the median-income family lacks sufficient income to purchase the median-priced home.
Housing matters to the economy. A lot. Not only does a strong housing market generate demand all on its own (think construction activity, home furnishings, and spending for services), but gains in home equity can also generate a powerful “wealth effect” that encourages homeowners to spend on other things, too. We’re hopeful that lower rates and slower price growth will improve affordability and allow more would-be homeowners to join the party. The outside risk? Should demand not materialize, severe price declines could occur, which might cause that wealth effect to run in reverse. |
But with AI spending undergirding the economy, the implications of economic splintering may be more political than economic
Approaching midterms may give a sense for who people hold accountable for the economic disparity. But while we think it’s possible weaker segments of the consumer base may drag on the economy on the margin, we expect AI spending to dictate the overall health of the economy.
This is both risk and opportunity
Our research suggests capex cycles are sensitive to the business cycle and stock-market drawdowns. And should the AI supercycle stall or — worst-case scenario — collapse, it’s hard to imagine the U.S. economy won’t feel the effects. On the flipside, should it continue apace, it’s hard to imagine a recession on the horizon.
We take a guardedly optimistic view on the buildout. The big spenders are generally well capitalized, spending from cash flow rather than taking out debt. However, this is changing (for example, in October Bloomberg reported that Meta had received orders of $125 billion for a jumbo bond sale) and is something worth watching over the course of 2026.
What about rates? Lower rates are another potential positive for the U.S. economy. The market is pricing in a series of cuts over the course of 2026, bringing us close to what the Fed has described as a “neutral” rate, or a rate that neither stimulates nor contracts the economy. That’s possible, particularly if the committee makeup takes a more dovish tilt under a new Fed chair. However, it’s worth remembering the inflation side of things: We’ve seen a longer tail of above-target inflation than most anticipated. Certainly it could cleanly slide lower from here, but allowing for the possibility it doesn’t — and curtails the Fed’s ability to act more aggressively — is key to planning for the range of outcomes we might face next year. |
Explore the outlook
Explore the outlook
Overview I Economy I Equity market I Bond market I AI I Housing market I Global debt
Investing involves risk, including possible loss of principal. The opinions expressed in this communication represent the current, good-faith views of Empower at the time of publication and are provided for limited purposes, are not intended as investment or legal advice, and should not be relied on as such. This content is based on the information available at the time of the recording and may change based on more current conditions. Past performance, where discussed, is not a guarantee of future results. Investing involves risk.
This is neither an endorsement of any index, sector, or investment, nor a solicitation to offer investment advice or sell products or services offered by Empower or its affiliates. It is impossible to invest directly in an index. The information presented was developed internally and/or obtained from sources believed to be reliable; however, Empower does not guarantee the accuracy, adequacy, or completeness of such information. Predictions, opinions, and other information contained in this communication are subject to change and without notice of any kind and may no longer be true after the date indicated. Commentary may contain forward-looking statements based on reasonable expectations, estimates, projections, and assumptions. Forward-looking statements are not guarantees of future performance and involve certain risks and uncertainties, which are difficult to predict.
Empower refers to the products and services offered by Empower Annuity Insurance Company of America and its subsidiaries. “EMPOWER” and all associated logos and product names are trademarks of Empower Annuity Insurance Company of America. ©2025 Empower Annuity Insurance Company of America. All rights reserved.
The S&P 500® Index (“Index”) and associated data are a product of S&P Dow Jones Indices LLC, its affiliates and/or their licensors and has been licensed for use by Empower Retirement, LLC. ©2025 S&P Dow Jones Indices LLC, its affiliates and/or their licensors. All rights reserved. Redistribution or reproduction in whole or in part are prohibited without written permission of S&P Dow Jones Indices LLC. For more information on any of S&P Dow Jones Indices LLC’s indices please visit www.spdji.com. S&P® is a registered trademark of Standard & Poor’s Financial Services LLC (“SPFS”) and Dow Jones® is a registered trademark of Dow Jones Trademark Holdings LLC (“Dow Jones”). Neither S&P Dow Jones Indices LLC, SPFS, Dow Jones, their affiliates nor their licensors (“S&P DJI”) make any representation or warranty, express or implied, as to the ability of any index to accurately represent the asset class or market sector that it purports to represent and S&P DJI shall have no liability for any errors, omissions, or interruptions of any index or the data included therein.
The research, views, and opinions contained in these materials are intended to be educational; may not be suitable for all investors; and are not tax, legal, accounting, or investment advice.
Empower and its affiliates are not providing impartial investment advice in a fiduciary capacity to the plan with respect to this material. The plan fiduciaries are solely responsible for the selection and monitoring of the planʼs investment options and for determining the reasonableness of all plan fees and expenses.
©2025 Empower Annuity Insurance Company of America. All rights reserved. INV-FBK-WF-5215980-1125 RO# 4958715-1125