
From Arkansas to Massachusetts: What defines middle class in each U.S. state
From Arkansas to Massachusetts: What defines middle class in each U.S. state
A state-by-state view shows how the middle expands or narrows by household size — and why the same income lands differently across the map.
From Arkansas to Massachusetts: What defines middle class in each U.S. state
A state-by-state view shows how the middle expands or narrows by household size — and why the same income lands differently across the map.

11.18.2025

Listen
·From Arkansas to Massachusetts: What defines middle class in each U.S. state
Key takeaways
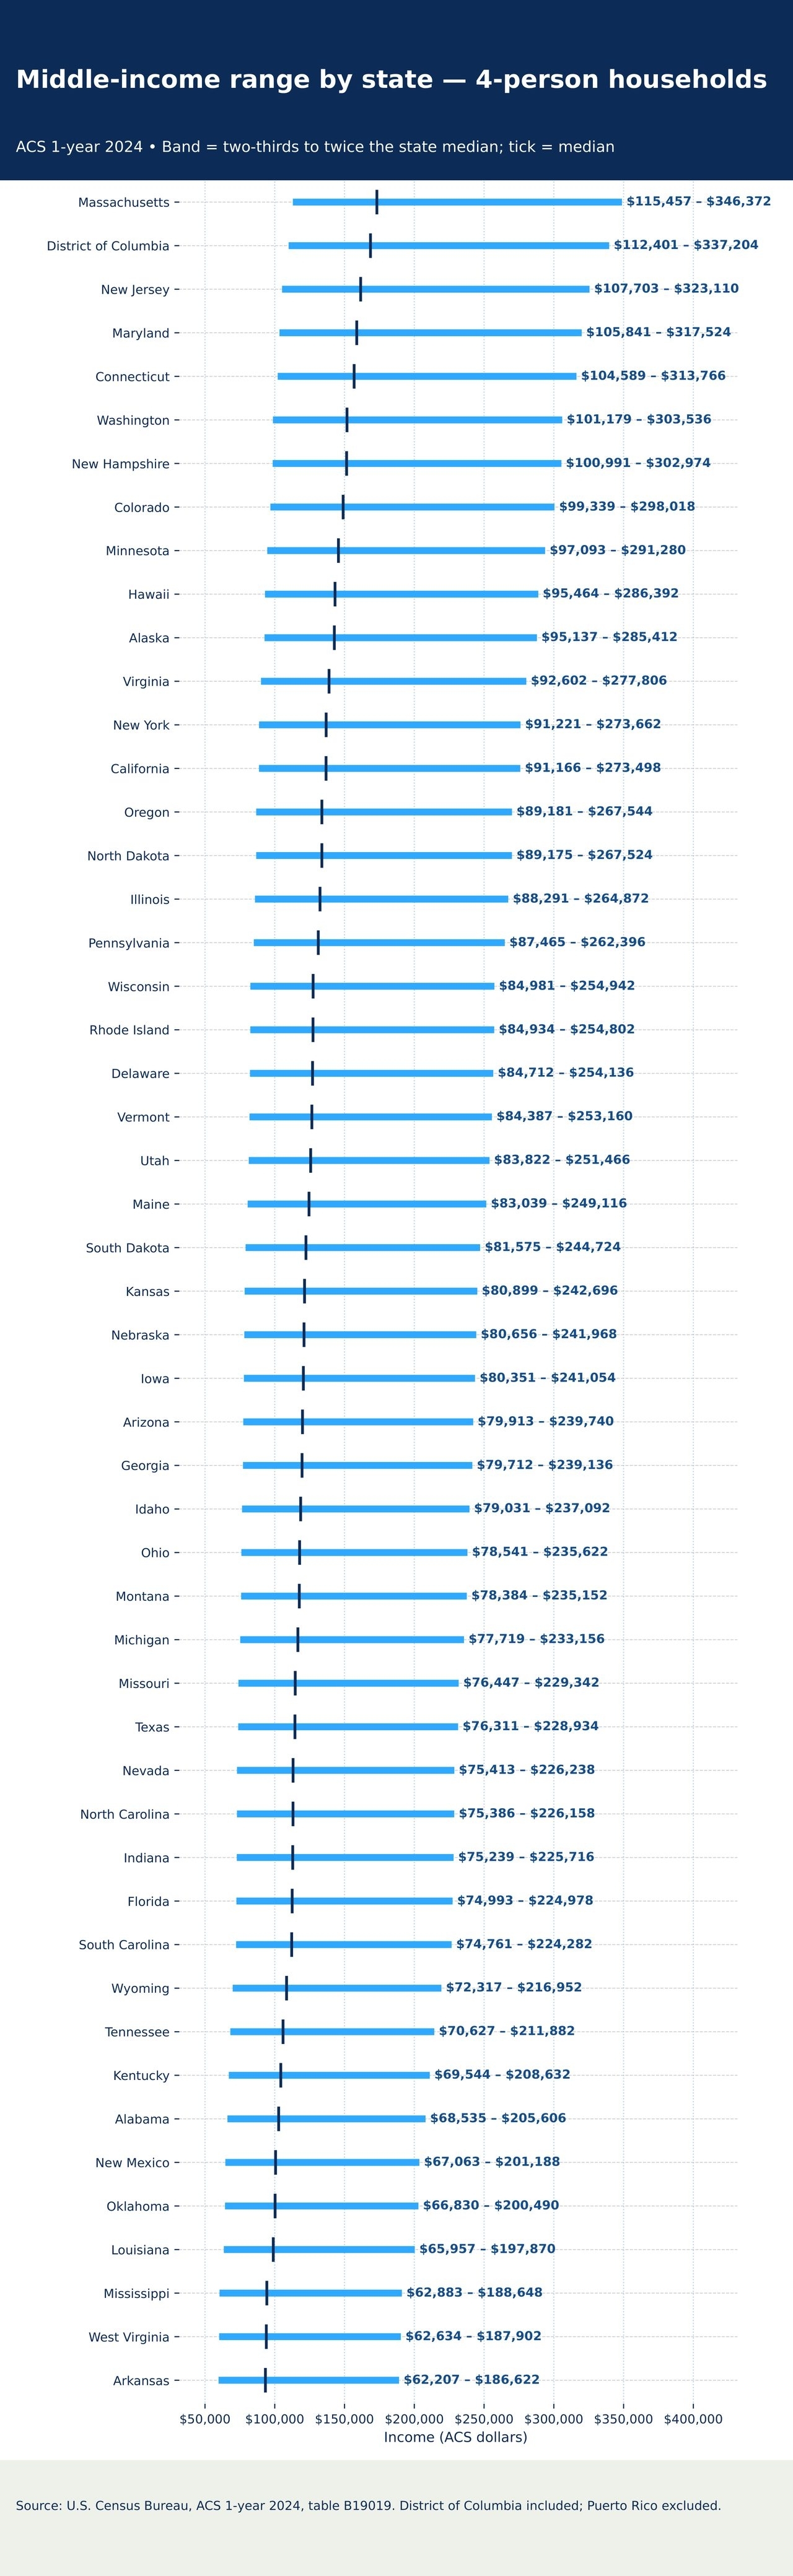
- Middle income or middle class is defined as two-thirds to twice the state median for the same household size.
- For four-person households, medians span from $93,311 in Arkansas to $173,186 in Massachusetts — implying middle-income bands of roughly $62,207–$186,622 and $115,457–$346,372.
- For one-person households, medians range from $30,310 in Mississippi to $78,400 in Washington, D.C.
- These bands reflect income distributions, not local prices; cost-of-living differences can shift purchasing power.
Using 2024 ACS one-year data, the analysis sizes middle income as two-thirds to twice each state’s median by household size. For four-person households, medians range from about $93,000 to $173,000; for one-person households, from roughly $30,000 to more than $78,000. These bands reflect income distributions, not prices, so purchasing power will differ once local costs are considered (for example, via BEA’s regional price parities).
Curious where income sits in each state? Here's a clear, numbers first look at middle-income ranges across the U.S. — and how to use them to pressure-test savings, emergency funds, and long-term goals. Using the U.S. Census Bureau data from the 2024 American Community Survey (ACS), this snapshot captures what middle income, or middle class, looks like in each state and reveals how location shapes which salaries sit in the middle.
How the middle is defined
Households are considered middle income if their annual income falls between two-thirds and twice the median for their state and household size.1 This framework, popularized by the Pew Research Center, scales with family composition and local income norms.
Because median incomes differ from one state to the next, the same paycheck can fit squarely within middle-income boundaries in one area yet barely make the cut in another, underscoring wide economic diversity across the U.S.
Four-person households: A wide spread
For four-person households, state medians vary sharply, using 2024 ACS data.2
Higher-income locales include:
- Massachusetts ($173,186)
- Washington, D.C. ($168,602)
- New Jersey ($161,555)
- Maryland ($158,762)
- Connecticut ($156,883)
Lower-income states include:
- Arkansas ($93,311)
- West Virginia ($93,951)
- Mississippi ($94,324)
- Louisiana ($98,935)
- Oklahoma ($100,245)
The same paycheck can sit squarely in the middle in one state and near the top of the distribution in another — a reminder that middle income is relative to local earnings, not a fixed dollar sign.
Read more: Becoming the 401(k) millionaire next door
One-person households: The range is even wider
Single-person medians show a similar gap, again using 2024 ACS data.3
Selected highs (median; middle-income band):
- Washington, D.C. — $78,400 ($52,267–$156,800)
- Maryland — $53,632 ($35,755–$107,264)
- Colorado — $51,959 ($34,639–$103,918)
Selected lows (median; middle-income band):
- Mississippi — $30,310 ($20,207–$60,620)
- West Virginia — $30,335 ($20,223–$60,670)
- Louisiana — $31,683 ($21,122–$63,366)
Again, figures reflect the income distribution in each place; they are not adjusted for what goods and services cost.
Why the middle shifts by state
Middle income is a moving target. State economies differ in industry mix, average pay, education levels, and the share of multi-earner households — all of which influence the median by household size. Purchasing power diverges further once local prices enter the picture.
According to the Bureau of Economic Analysis, Regional Price Parities (RPPs) quantify those differences by state and metro; applying RPPs shows how an identical dollar can buy more, or less, based on location.4 Empower research highlights why this matters: Americans spend nearly four hours a day thinking about money, and more than one-third say they lose sleep over financial worries.
Read more: Tax smart strategies for year-end planning
Why it matters for financial planning
Benchmarks like these can help set expectations and policies — and inform everyday financial choices. These state-by-state ranges offer a clear baseline for setting savings milestones and long-term goals, including:
- Compensation and careers: Employers can compare pay bands with state-level income medians by household size to calibrate offers and relocation packages. Job seekers assessing cross-state moves can read the same signal.
- Housing and community planning: Middle-income ranges help align housing supply with likely demand — a practical input to zoning, infrastructure, and workforce development.
- Purchasing-power reality check: Because these are nominal incomes, layering in BEA RPPs — or similar cost-of-living lenses — provides a truer picture of how far a middle-income paycheck stretches in any given place.
Middle income bands for all 50 states and the District of Columbia:
Methodology
- Dataset: U.S. Census Bureau, American Community Survey (ACS), 1-year, 2024, Table B19019 (Median Household Income in the Past 12 Months by Household Size).
- Definition: Middle income = two-thirds to twice the state median for each household size (1, 2, 3, 4, 5, 6, 7+), following Pew Research Center’s convention.
- Geography: 50 states + Washington, D.C.; Puerto Rico excluded.
- Rounding & uncertainty: Point estimates rounded to the nearest dollar; margins of error are not shown here. ACS releases are estimates and subject to sampling error.
- Prices: Incomes are not adjusted for local price levels. For cost-of-living context, see BEA Regional Price Parities.
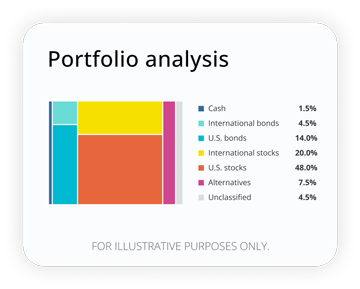
How well are your investments performing?
Analyze your portfolio in minutes and receive a target allocation for your goals.
1 Pew Research Center, “Are you in the American middle class? Find out with our income calculator,” September 16, 2024. 2 U.S. Census Bureau, “2024 American Community Survey (ACS). B19019. Median Household Income in the Past 12 Months (in 2024 Inflation-Adjusted Dollars) by Household Size,” Accessed November 2025. 3 Ibid 4 Bureau of Economic Analysis, “Regional Price Parities by State and Metro Area,” Accessed November 2025.
RO4993447-1125


The Currency editors
Staff contributors
The CurrencyTM writers and editors cover the latest financial news and insights shaping how we live, work, and play. The team provides accurate, data-driven, and timely content aimed at empowering financial freedom for all.
The content contained in this blog post is intended for general informational purposes only and is not meant to constitute legal, tax, accounting or investment advice. You should consult a qualified legal or tax professional regarding your specific situation. No part of this blog, nor the links contained therein is a solicitation or offer to sell securities. Compensation for freelance contributions not to exceed $1,250. Third-party data is obtained from sources believed to be reliable; however, Empower cannot guarantee the accuracy, timeliness, completeness or fitness of this data for any particular purpose. Third-party links are provided solely as a convenience and do not imply an affiliation, endorsement or approval by Empower of the contents on such third-party websites. This article is based on current events, research, and developments at the time of publication, which may change over time.
Certain sections of this blog may contain forward-looking statements that are based on our reasonable expectations, estimates, projections and assumptions. Past performance is not a guarantee of future return, nor is it indicative of future performance. Investing involves risk. The value of your investment will fluctuate and you may lose money.
Certified Financial Planner Board of Standards Inc. (CFP Board) owns the certification marks CFP®, CERTIFIED FINANCIAL PLANNER™, CFP® (with plaque design), and CFP® (with flame design) in the U.S., which it authorizes use of by individuals who successfully complete CFP Board's initial and ongoing certification requirements.