
The global debt problem

Overview I Economy I Equity market I Bond market I AI I Housing market I Global debt
U.S. economic and market outlook 2026
The global debt problem
In 2025, as the U.S. dollar sold off and tariffs went up, investors worried about U.S. debt troubles
Rightly so: U.S. debt to GDP stands at 125%, according to International Monetary Fund (IMF) calculations.
But the U.S. isn’t alone in shouldering a massive debt burden. In advanced economies, total debt to GDP stands at 110%, with countries like Japan (230%), France (117%), and Singapore (176%) sporting similar or higher levels of debt to GDP than the U.S.
Echoing Ernest Hemingway, the debt troubles have come on “gradually and then suddenly.” The trajectory has headed north for decades, but universal government intervention first during the Global Financial Crisis and later during COVID accelerated the trend, bringing the world to the levels we see today.
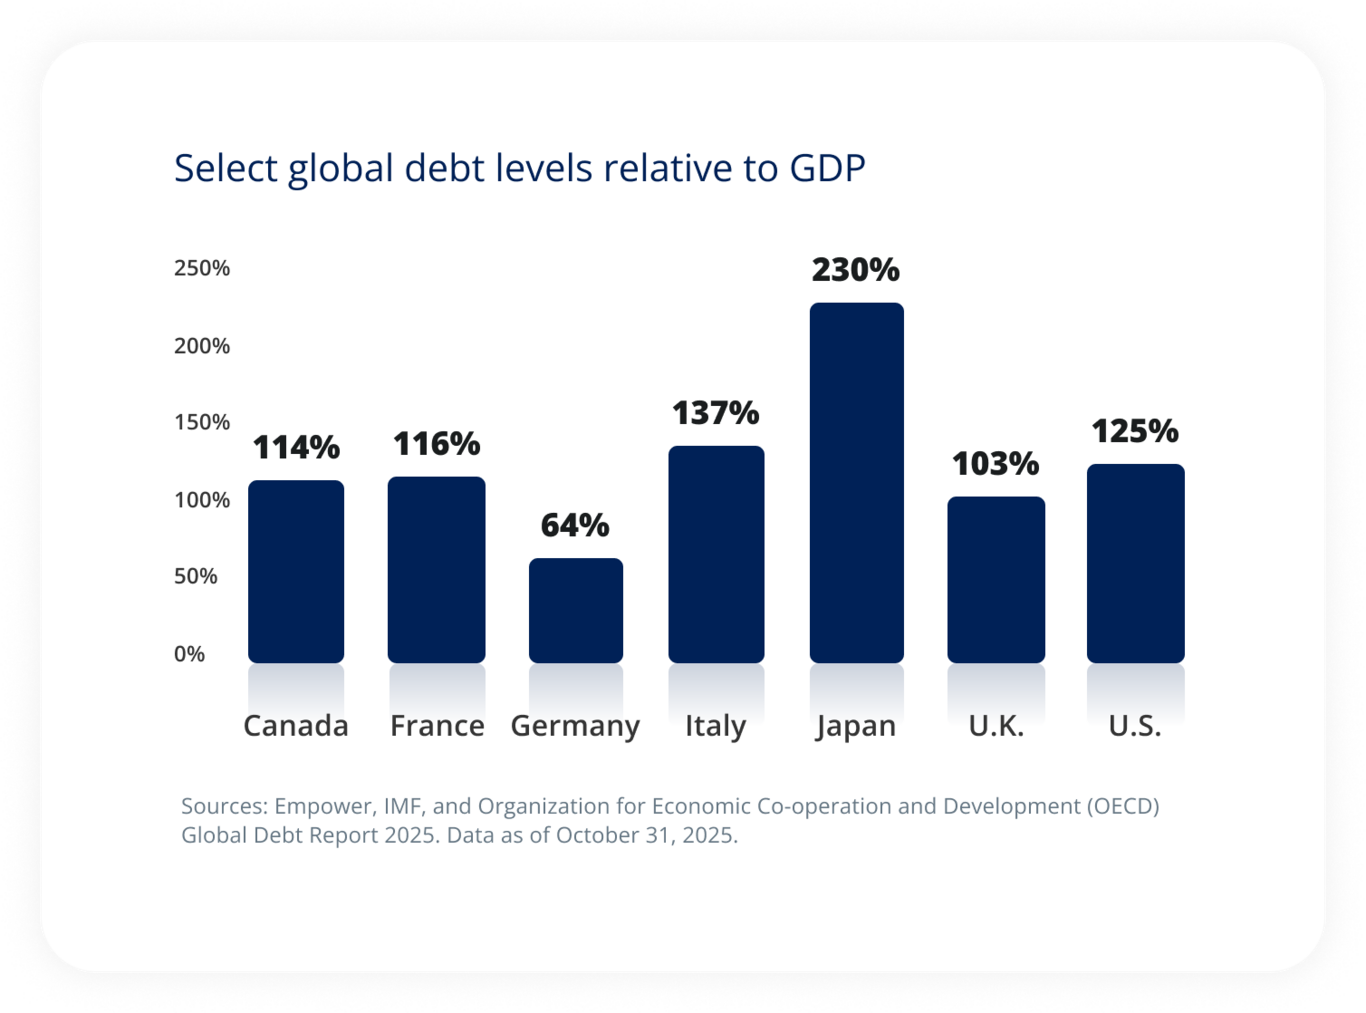
We look at the gross debt levels relative to GDP for the G7 economies. We find that sovereign debt is high in the U.S., but not uniquely high. With the exception of Germany, advanced economies are awash in debt. The concern front of mind for investors: Will the high levels of debt around the globe cause investors to demand higher yields? OECD observes that, under quantitative tightening, central banks stepped back from debt markets, while retail and foreign investors stepped in. The latter tend to be more price sensitive and focused on relative yields.
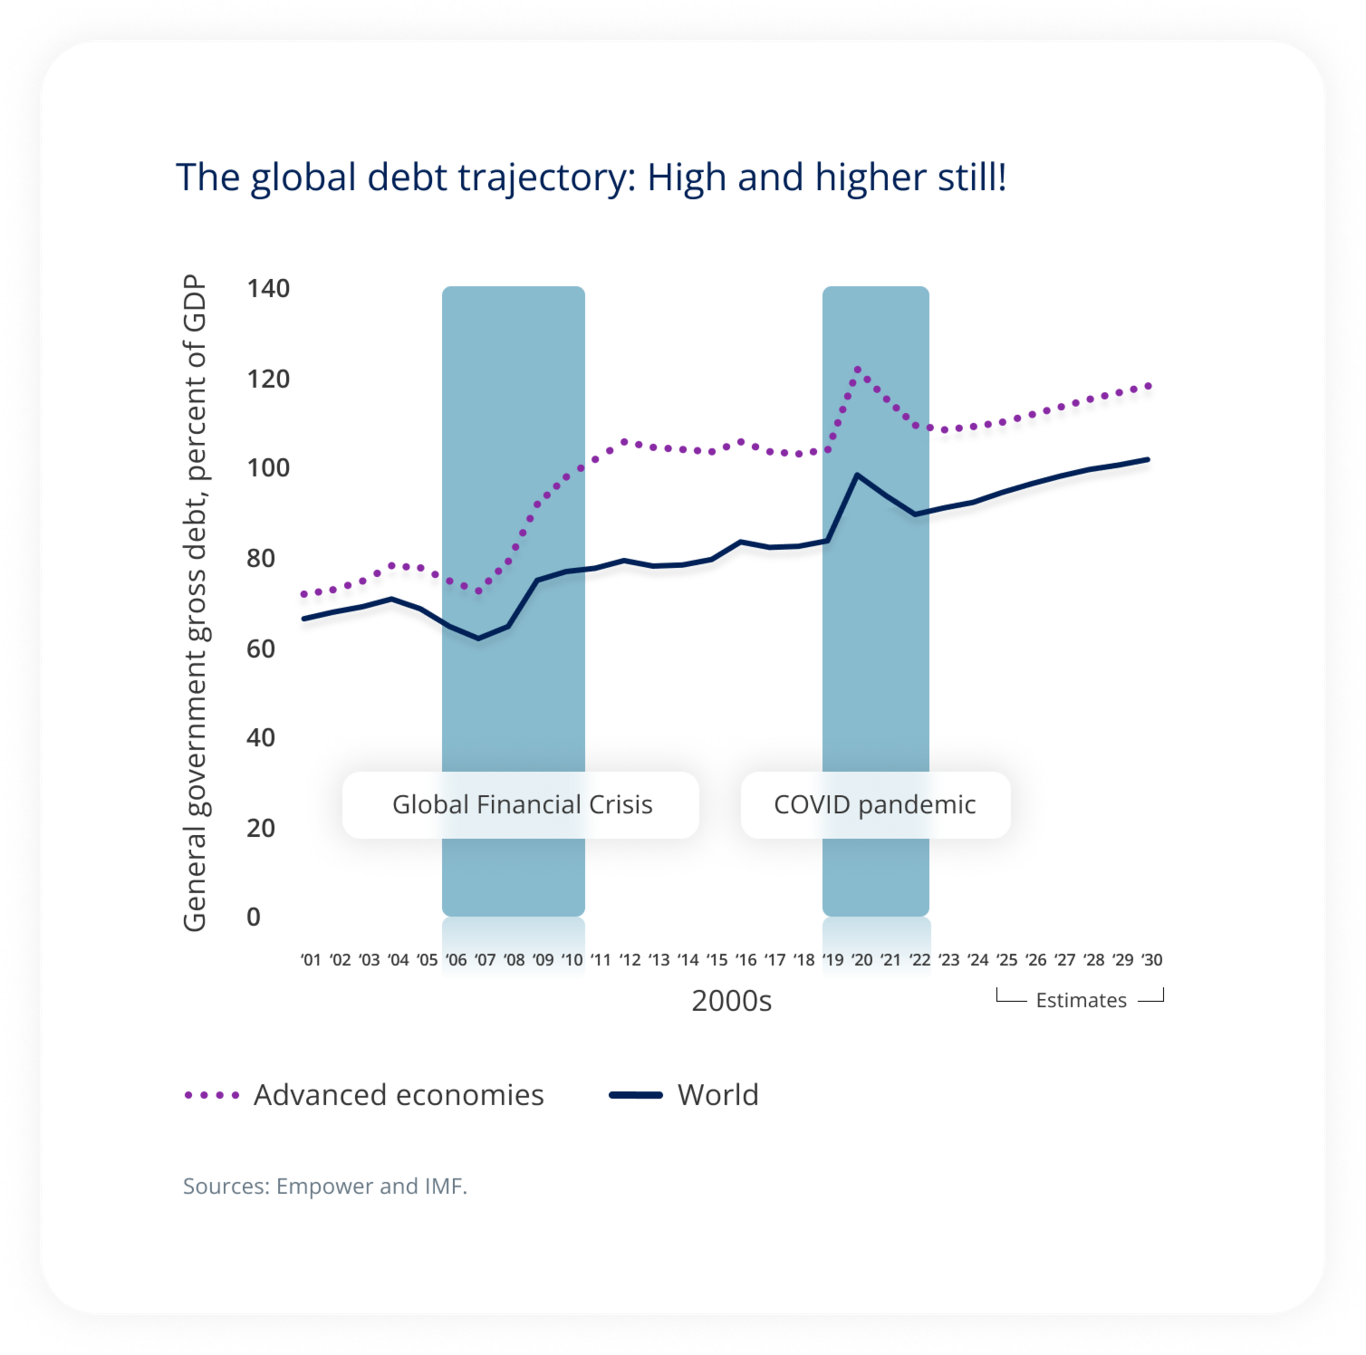
The first shaded area is the Global Financial Crisis and the second shaded area is the Covid pandemic. Sovereign debt has tracked steadily higher over the decades. However, with governments extending to soften the blows of the Global Financial Crisis and 2020 Pandemic, debt levels step-functioned higher in both periods. And in the wake of those periods, debt levels did not come back down. As a result, we now face a trajectory around the world that charts ever higher.
More to come
The IMF expects the trend to continue, anticipating that global government debt could hit 100% of GDP by 2029, which would be the highest level since the aftermath of World War II.
It’s not just the level of debt that is a concern, it's the cost
In the U.S., the Department of the Treasury and Bureau of the Fiscal Service report the cost of debt service — the interest rate payments on the debt — has sharply risen as rates have climbed. It now stands at $1,216 billion (that’s 17% of federal spending). OECD points out that 42% of all global sovereign debt is set to mature by 2027, meaning that debt that was previously underwritten during periods of very low interest rates may reset at higher rates.
Plus, more debt may be coming
In 2025, NATO members agreed to higher defense spending, increasing the overall military budget to 5% of GDP by 2035. The runway to ramp up is long, but necessary; European NATO members found the previous 2% target challenging. We first showed the impact of this shift in our 2025 Retrospective, and we have included the graph here as well (see below).
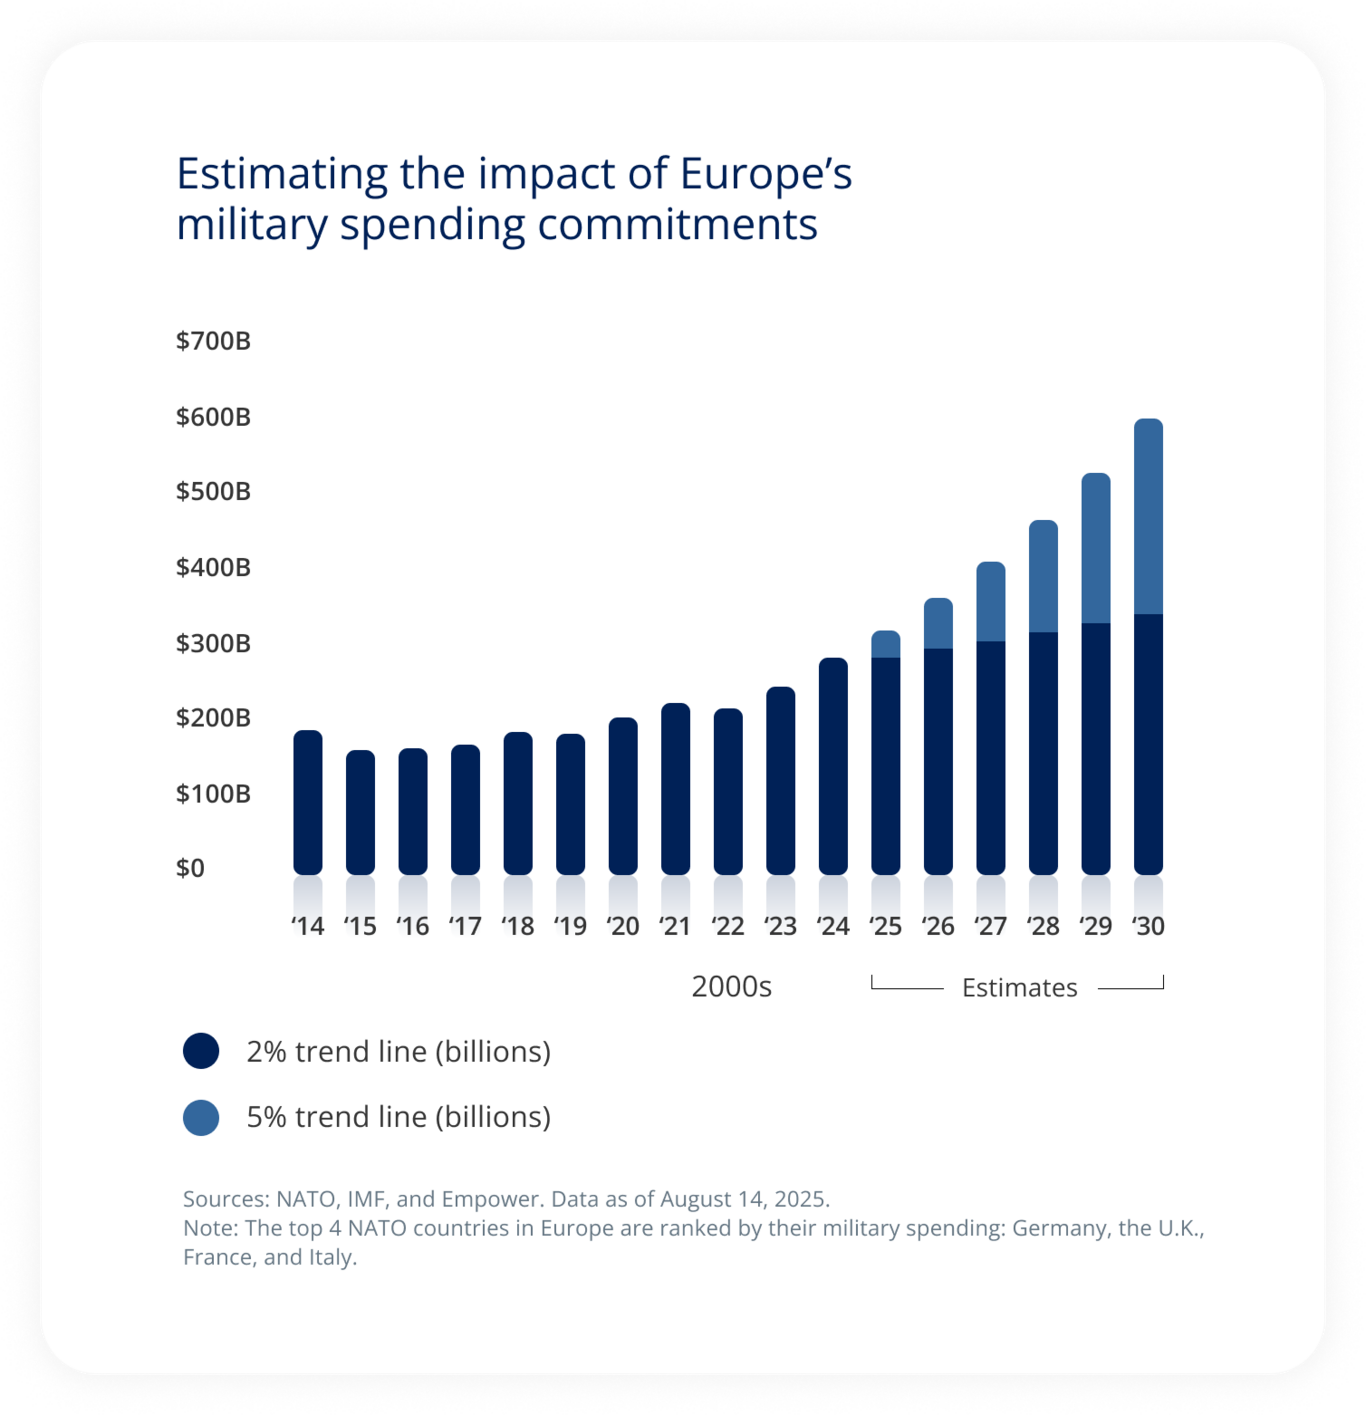
Our analysis looks at the estimated impact of Europe's military spending commitments. The top four NATO members in Europe, namely Germany, the UK, France, and Italy, are projected to grow their combined
defense spending to $597 billion, well above the $341 billion that would have resulted from sticking to the 2% of Gross Domestic Product (GDP) trendline.
While this spend could come from reallocating budgets or higher taxes, most experts expect NATO members to finance at least a portion with debt issuance. That’s already begun: Germany, Finland, and Belgium announced higher borrowing needs in the second half of 2025; government bond yields edged higher as a result.
The concerns may be spurring political action. However, politicians — including those in the U.S. — have yet to articulate clear, actionable plans.
Tariffs alone are not enough
Despite the new, astonishingly high tariff levels, tariff revenue collected in 2025 through August only amounted to 3.5% of total government revenue in fiscal year 2025.
The deficit to GDP dropped modestly in 2025 According to the Treasury Department, it fell from 6.3% in 2024 to 5.9% — with the tariff take helping the cause. As of October 20, 2025, the U.S. has brought in $197 billion in gross tariff revenue. This is still small relative to the size and scale of the U.S. government’s budget. In August, tariff revenue accounted for just 3.5% of the total revenue in fiscal year 2025. |
Investment implications
It's hard to time bound debt concerns to 2026 with any degree of accuracy. However, we see several potential investment implications investors need to monitor in 2026 in order to understand whether the magnitude of the debt burden has begun to impact their portfolios.
1
Pressure on the long end of sovereign yield curves around the world,
including the U.S.
The Federal Reserve Bank of Dallas found that for each percentage point increase in debt to GDP, long-term yields rise by three basis points (0.03%).
Don’t misunderstand the nature of the problem: This doesn't necessarily mean we think the 10-year Treasury yield will spike in 2026; the debt issue is the steeplechase, not the 100-meter dash. Plus, if we see lower growth or lower inflation, they could push against higher long-term rates.
Here’s our takeaway: While forces could push long-term rates lower, we think debt levels could prevent rates from falling as much as they otherwise would. This has implications for the everyday consumer. Of particular concern — mortgage rates. If sovereign debt keeps the long end of the curve at the higher end, mortgage rates may not offer much relief, and fewer potential buyers may be able to enter the housing market.
2
Select currency weakness
Currencies are measured against one another — for example, the price of the U.S. dollar in Japanese Yen or the price of Euros relative to the British pound. Given that debt concerns are global, we may find that other considerations — like the path of interest rates — matter more to currency investors in 2026.
However, if debt troubles really begin to spiral for a particular region or country — France is facing acute pressure, for example, which could have Euro implications — we may find the related currency sinking in value relative to other, more stable currencies.
3
Gold: What a run!
After gold’s 53% year-to-date climb through October 31, 2025, everyone is a gold bug these days. But we are a bit leery. The current gold run didn't begin as debt concerns came to the fore in 2025, but a year before, as central banks around the world stepped up their efforts to diversify their U.S. dollar exposure in the wake of the Russian sanctions.
Countries just don't want to find themselves easily shut out, financially, and gold offers a protection from that. The heavy central bank buying pushed gold prices higher, attracting institutional and retail investors to what is arguably a momentum trade, though investors can hide it under “debasement” concerns.
This creates vulnerability: We could very well see gold sell off even as debt concerns linger.
4
Bitcoin
While bitcoin hasn’t seen quite the run gold has seen, it's had better returns than the U.S. stock market nonetheless. After returning 122% in 2024 — with much of those gains coming post 2024 presidential election — bitcoin had a weak start to the year before rallying and returning 17.5% year-to-date though October 31.
But here again it’s hard to argue bitcoin returns are 100% related to dollar-debasement concerns. Perhaps that is the case of the margin, but the real enthusiasm began with the prospect of President Trump's crypto-friendly administration. That has borne fruit, as regulation gains accrued to the crypto industry.
It stands to reason this will continue for the next few years, but the difficulty in determining just what exactly crypto is worth — even for the more mainstream crypto currencies like bitcoin and stablecoin — creates vulnerabilities.
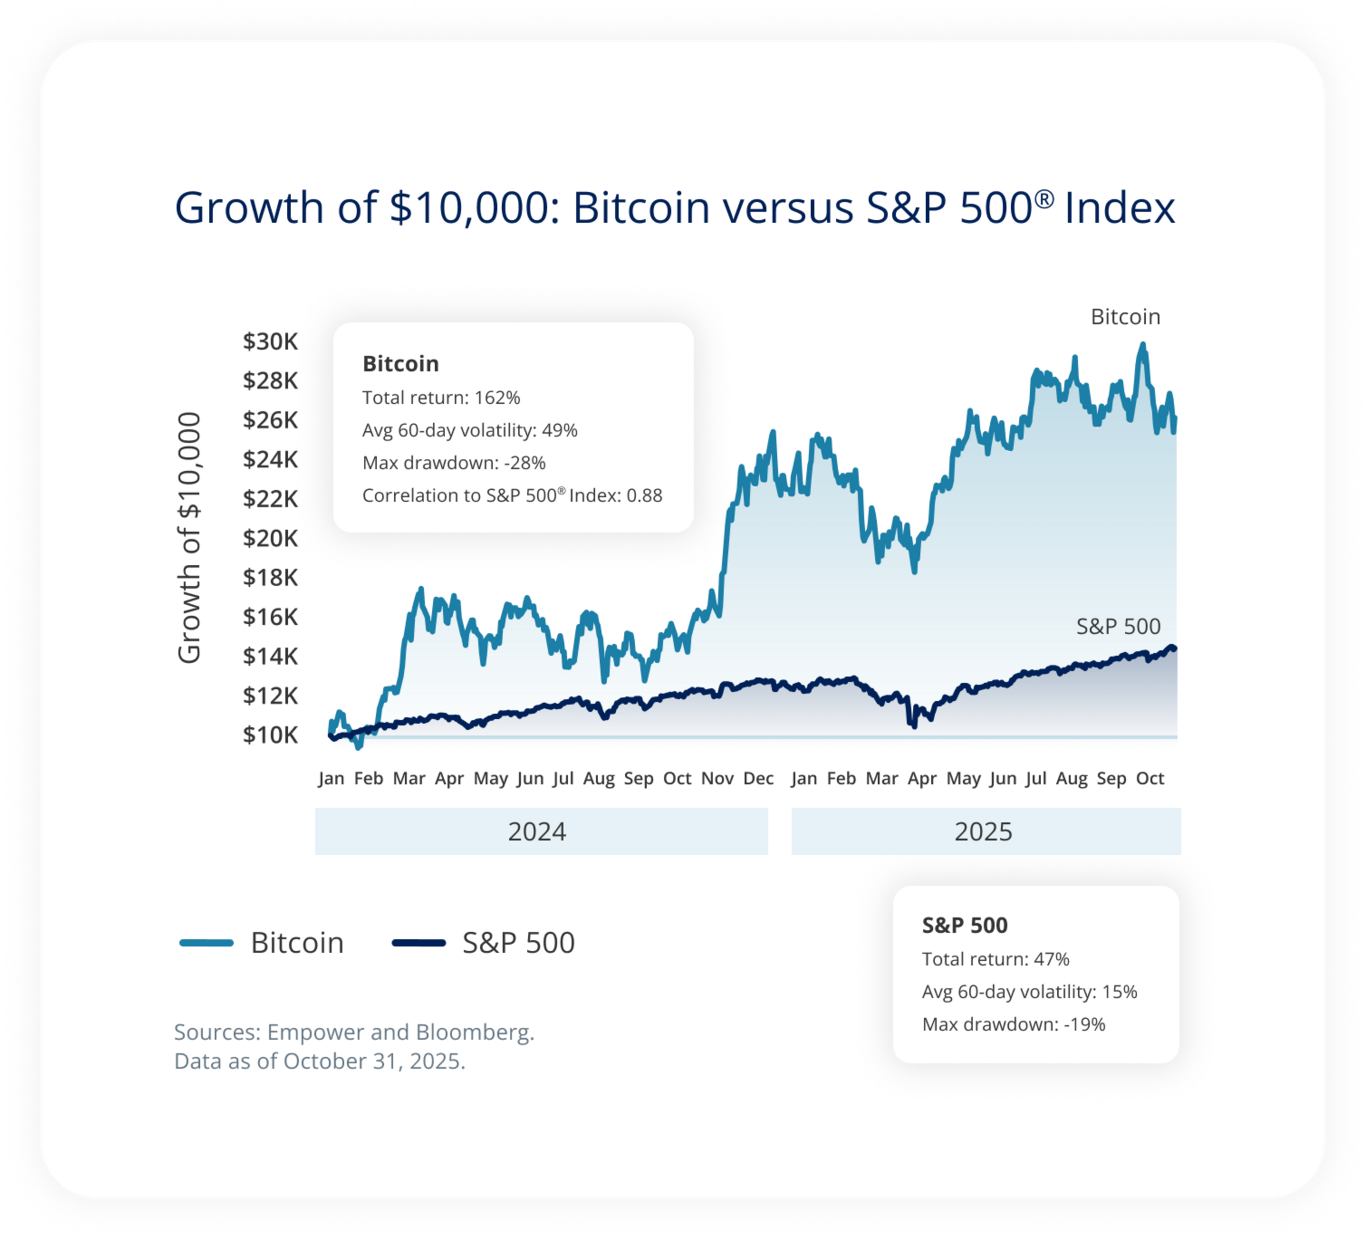
It's been a great run for crypto investors. You could argue it's largely the result of a crypto-friendly administration: Look at that jump post presidential election. The majority of the gains over this period where in the last two months of 2024!
We don't disagree with the idea that crypto broadly, and potentially select currencies in particular, stand to gain if we enter a period of investor concern around global sovereign debt. But it's important that investors know the real profile of this asset class: Over the 2024/2025 period, bitcoin--as a representative currency--has showcased the volatility of a speculative asset class, with more severe drawdowns than those of the U.S. equity market, and correlation to U.S. equities of close to 0.9. This is not necessarily a "diversifying" asset class.
Long-term interest rates According to the Federal Reserve Bank of Dallas, holding all else equal, long-term interest rates could rise more than 1.5 percentage points over the next 30 years if debt levels rise as projected by the Congressional Budget Office. |
Explore the outlook
Explore the outlook
Overview I Economy I Equity market I Bond market I AI I Housing market I Global debt
Sources:
IMF, 2025.
The Department of the Treasury and the Bureau of the Fiscal Service.
OECD, "Global Debt Report: Financing Growth in a Challenging Debt Market Environment," March 20, 2025.
Bloomberg, "US Tariff Take Helps Trim 2025 Deficit to $1.78 Trillion," October 16, 2025.
Bipartisan Policy Center, "How Much Are U.S. Tariffs Raising in Revenue?", 2025.
The Federal Reserve Bank of Dallas, "Revisiting the Interest Rate Effects of Federal Debt," July 2025.
The research, views, and opinions contained in these materials are intended to be educational; may not be suitable for all investors; and are not tax, legal, accounting, or investment advice.
Empower and its affiliates are not providing impartial investment advice in a fiduciary capacity to the plan with respect to this material. The plan fiduciaries are solely responsible for the selection and monitoring of the planʼs investment options and for determining the reasonableness of all plan fees and expenses.
Investing involves risk, including possible loss of principal. The opinions expressed in this communication represent the current, good-faith views of Empower at the time of publication and are provided for limited purposes, are not intended as investment or legal advice, and should not be relied on as such. This content is based on the information available at the time of the recording and may change based on more current conditions. Past performance, where discussed, is not a guarantee of future results. Investing involves risk.
This is neither an endorsement of any index, sector, or investment, nor a solicitation to offer investment advice or sell products or services offered by Empower or its affiliates. It is impossible to invest directly in an index. The information presented was developed internally and/or obtained from sources believed to be reliable; however, Empower does not guarantee the accuracy, adequacy, or completeness of such information. Predictions, opinions, and other information contained in this communication are subject to change and without notice of any kind and may no longer be true after the date indicated. Commentary may contain forward-looking statements based on reasonable expectations, estimates, projections, and assumptions. Forward-looking statements are not guarantees of future performance and involve certain risks and uncertainties, which are difficult to predict.
Empower refers to the products and services offered by Empower Annuity Insurance Company of America and its subsidiaries. “EMPOWER” and all associated logos and product names are trademarks of Empower Annuity Insurance Company of America. ©2025 Empower Annuity Insurance Company of America. All rights reserved.
The S&P 500® Index (“Index”) and associated data are a product of S&P Dow Jones Indices LLC, its affiliates and/or their licensors and has been licensed for use by Empower Retirement, LLC. ©2025 S&P Dow Jones Indices LLC, its affiliates and/or their licensors. All rights reserved. Redistribution or reproduction in whole or in part are prohibited without written permission of S&P Dow Jones Indices LLC. For more information on any of S&P Dow Jones Indices LLC’s indices please visit www.spdji.com. S&P® is a registered trademark of Standard & Poor’s Financial Services LLC (“SPFS”) and Dow Jones® is a registered trademark of Dow Jones Trademark Holdings LLC (“Dow Jones”). Neither S&P Dow Jones Indices LLC, SPFS, Dow Jones, their affiliates nor their licensors (“S&P DJI”) make any representation or warranty, express or implied, as to the ability of any index to accurately represent the asset class or market sector that it purports to represent and S&P DJI shall have no liability for any errors, omissions, or interruptions of any index or the data included therein.
©2025 Empower Annuity Insurance Company of America. All rights reserved. INV-FBK-WF-5216790-1125 RO# 4958715-1125