
Housing is on its ear

Overview I Economy I Equity market I Bond market I AI I Housing market I Global debt
U.S. economic and market outlook 2026
Housing is on its ear
Prices are high and mortgage rates have yet to react aggressively to ongoing rate cuts by the Federal Reserve
As a result, affordability has remained out of reach for many would-be buyers, and for-sale inventories are left at unusually high levels. That can be a problem because housing activity is one of the most powerful stimulants for a slowing economy, both directly — through things like construction activity and higher gross personal investment — as well as indirectly via "knock-on spending" for moving services, home improvement, and countless others.
There is also a powerful and well-documented "wealth effect" associated with homeownership: Consumers flush with freshly minted home equity might be more inclined to spend aggressively than those without.
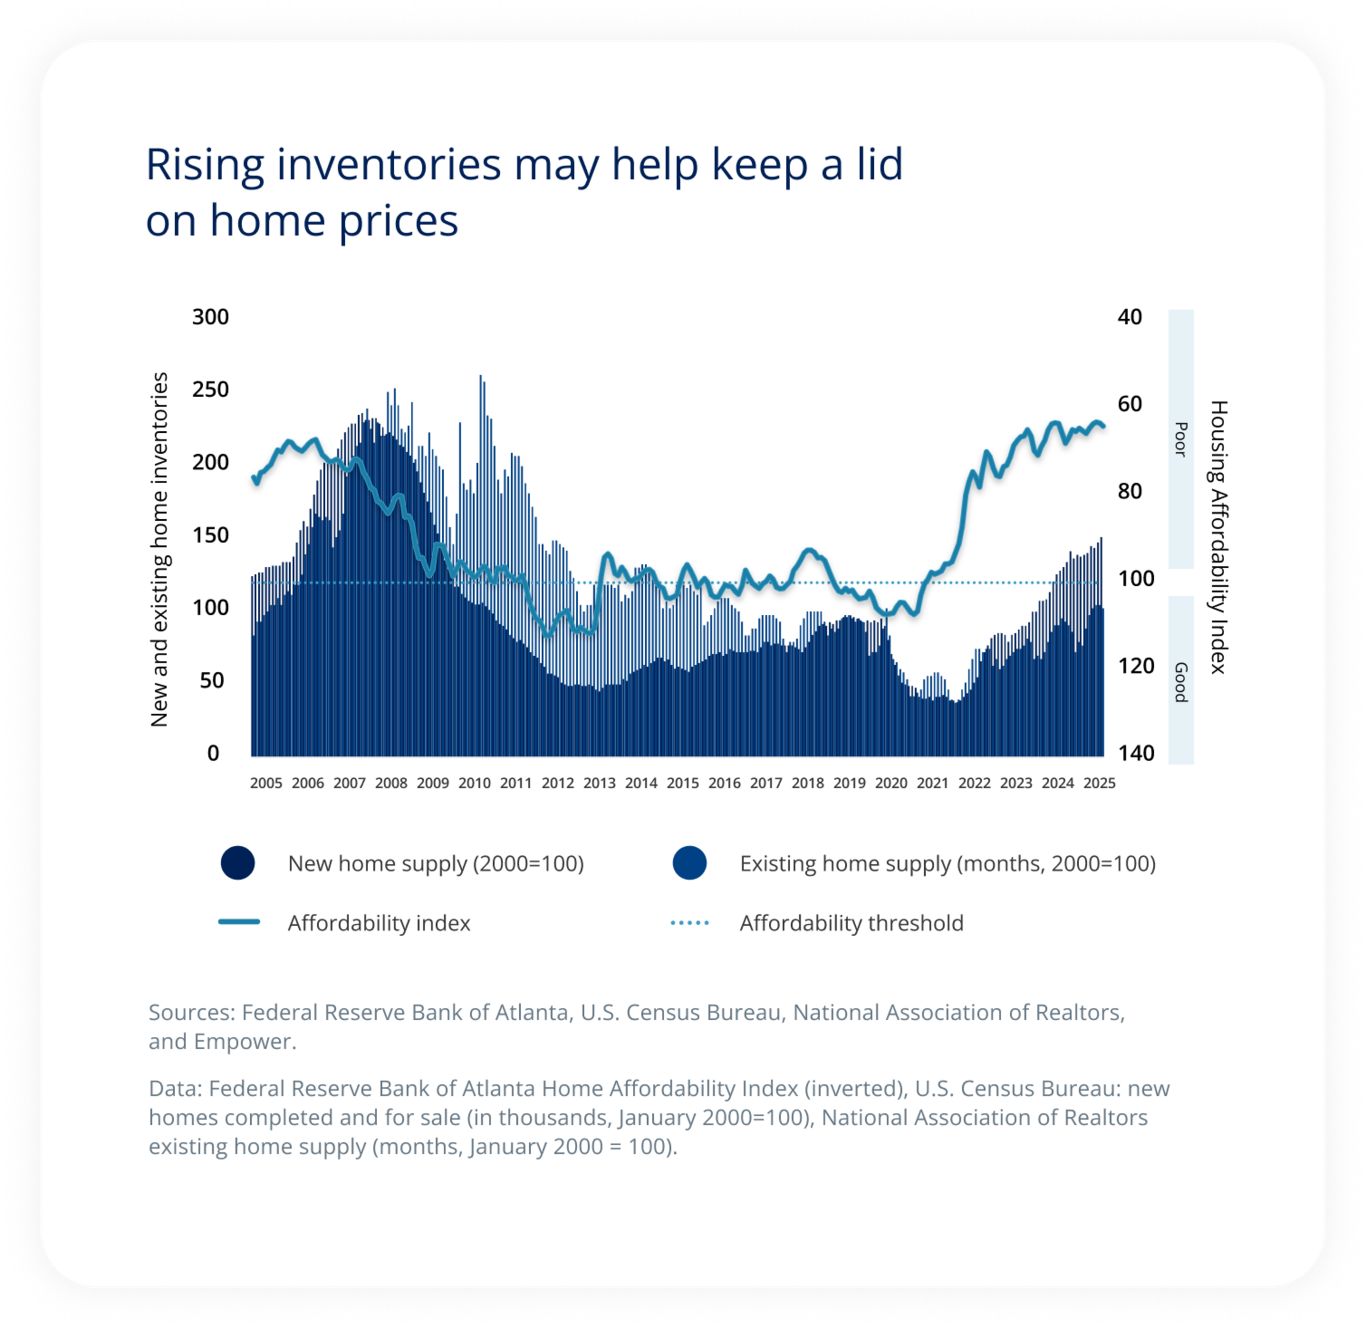
Affordability has declined, causing housing inventories to rise. We think this will keep a lid on prices, but won't cause a collapse like 2008-2009.
The U.S. housing market has an affordability crisis,
but one we think could resolve in time
As homes have become less affordable, people are buying fewer of them (represented by the solid line in the chart above: Higher is worse/less affordable, lower is better/more affordable). That has caused inventories to rise, both for new and existing/resale homes (dark blue bars). It has also created a temporary (or “cyclical”) over-supply situation — even in the midst of long-term structural under-supply — that in our view will keep a lid on prices for the near future.
We think the best possible outcome would be flat/slower home price growth accompanied by continued real wage growth and tame inflation, which would allow affordability to improve — effectively, wages would “catch up” to home prices over a period of months or years, ultimately improving affordability and returning housing markets to a more solid foundation.
Near term, affordability should improve (but not because of prices)
We’re hopeful that home affordability will improve at least modestly if rates edge down.
But we have less faith in declining home prices coming to the rescue: Years of slow activity have created pent-up demand that should help clear high inventories of new and existing homes without drastic declines in price, especially if the economy continues to muddle along enough to support at least moderate growth in real wages.
But that’s probably good news because if home prices were to decline as aggressively as they did during the housing bubble, the wealth effect could easily start running in reverse and cause consumer spending to stall. In fact, the twin risks of a sharp decline in both home prices and the stock market continue to underpin our “bear case” for the U.S. economy, particularly if they were to occur simultaneously.
Let’s unpack the “wealth effect” a bit more
For the average American family, “wealth” comes principally from two sources: home equity and portfolio investments/stocks.
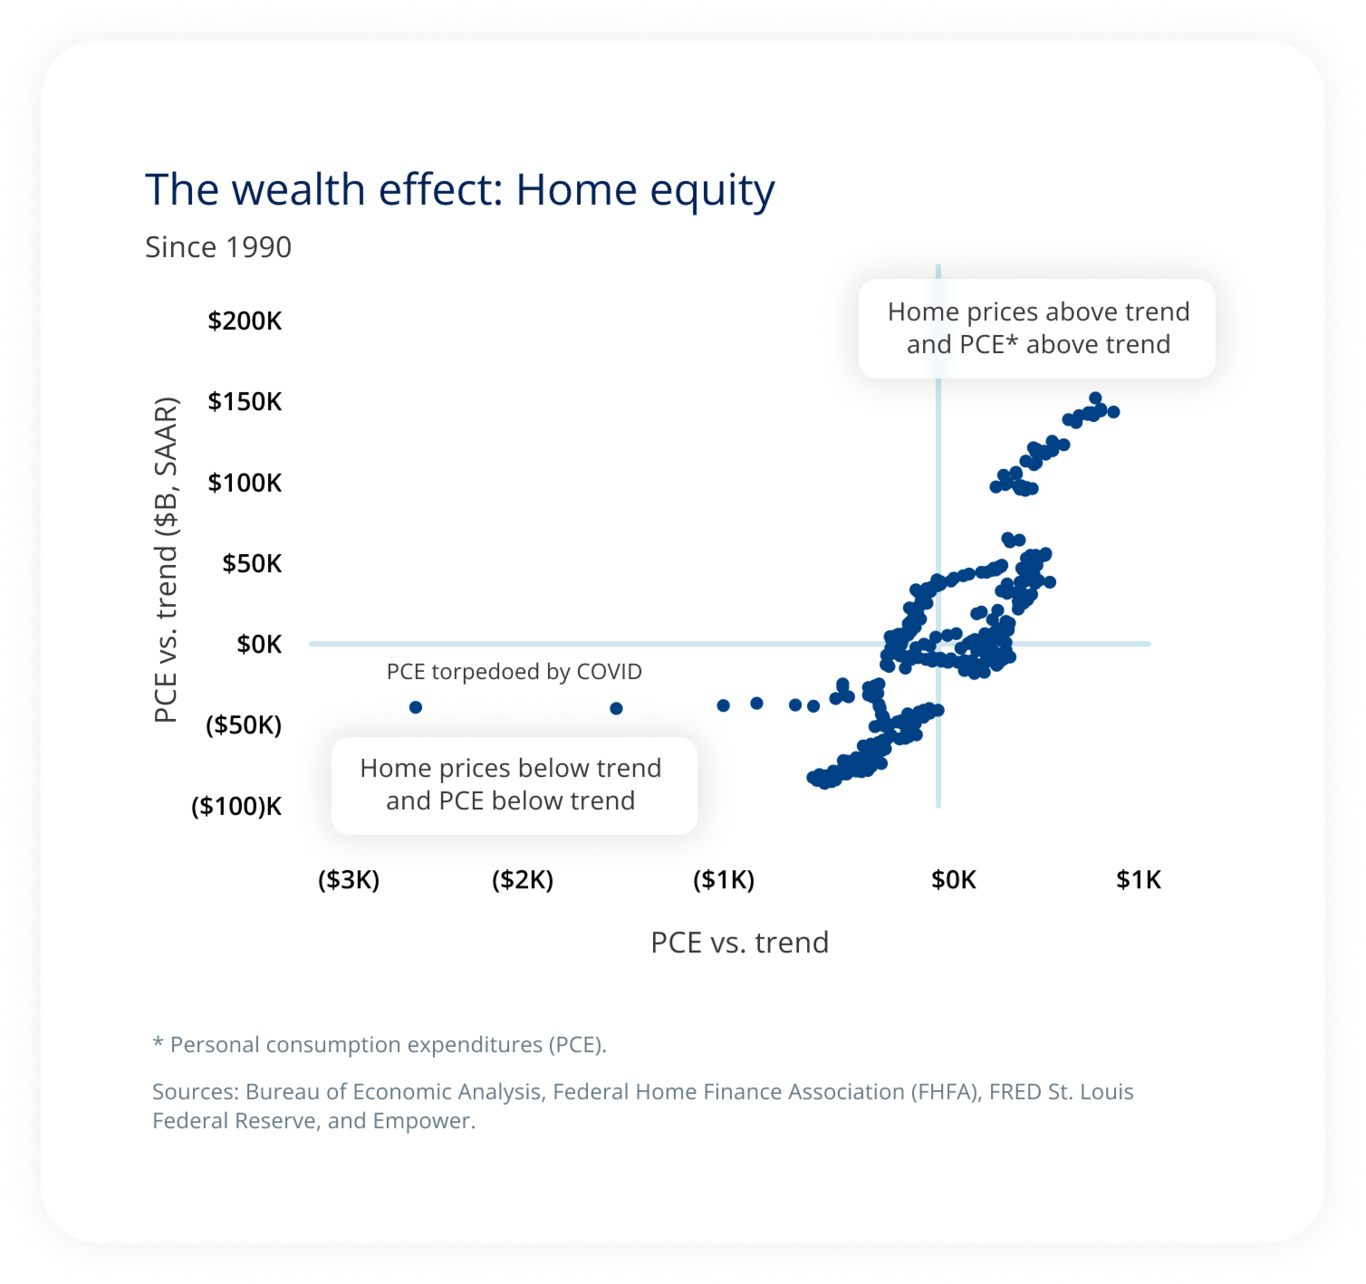
Home equity is one of two main sources of the "wealth effect" that encourages consumers to spend more. When home equity is growing above trend, so is consumer spending.
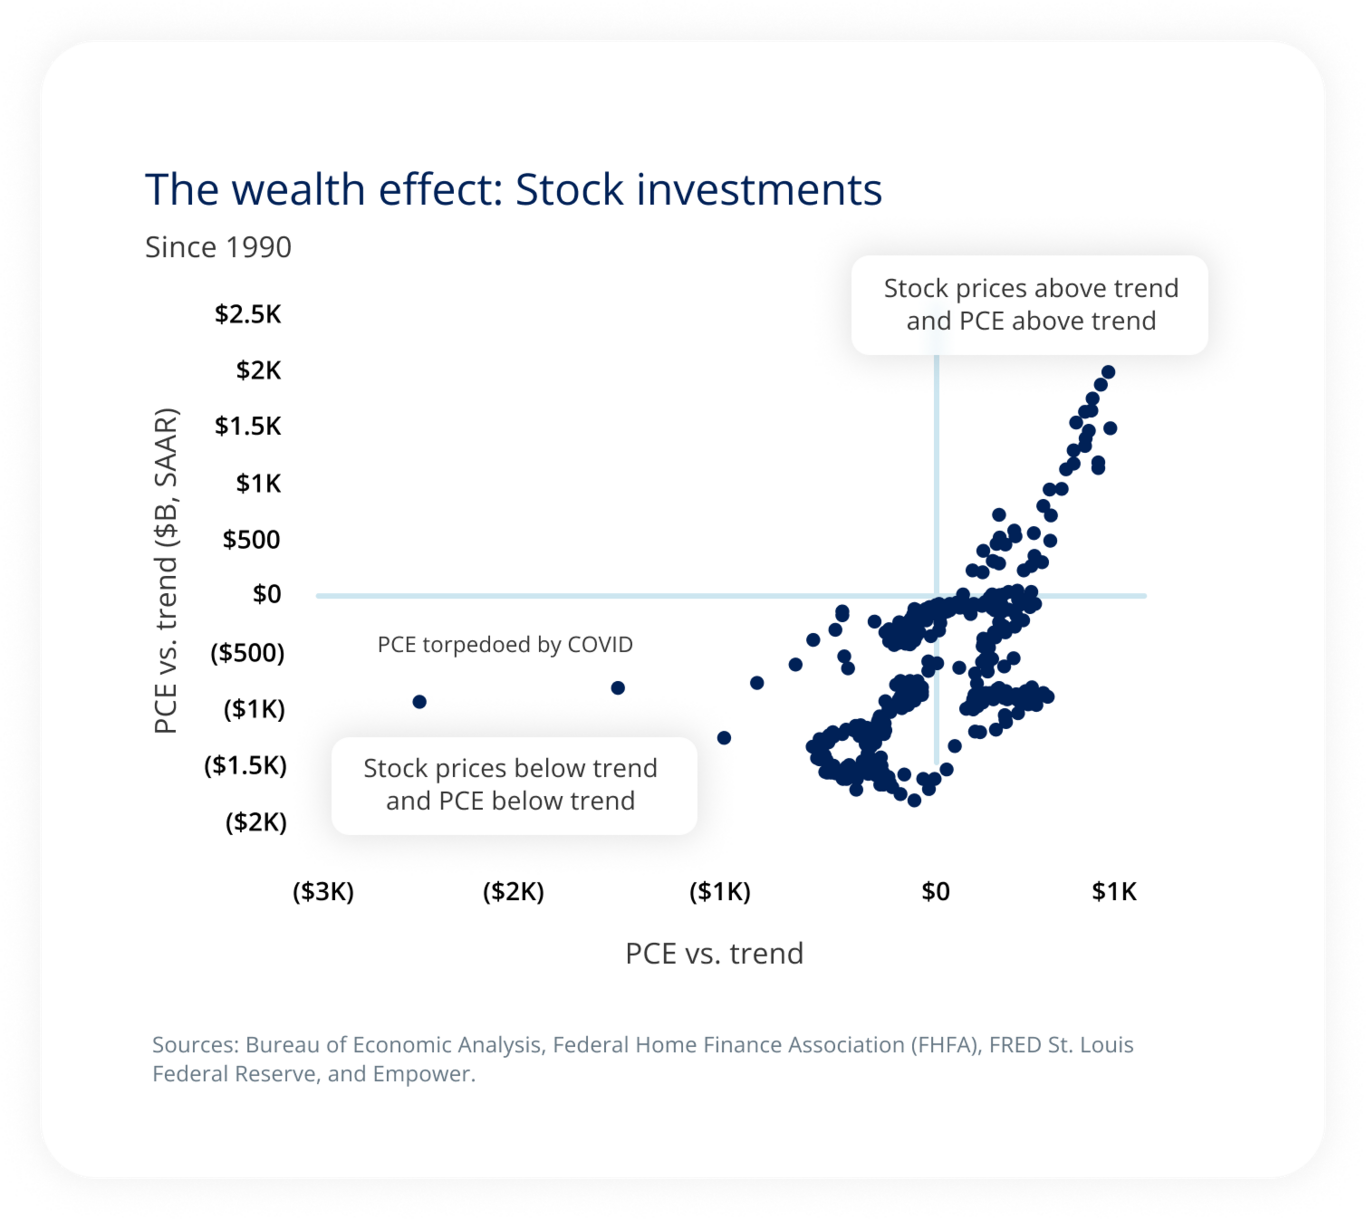
The other main source of the wealth effect for most consumers is their investments in the stock market. Like home equity, when stock prices are rising fast, so is consumer spending.
The two charts above compare changes in spending to changes in home equity (the wealth effect: home equity) and changes in spending to changes in stocks (the wealth effect: stock investments).
In both cases, when wealth is growing above trend, you would expect spending to also be above trend: The dots will tend to lie in the upper right-hand quadrant. Conversely, when wealth is growing below trend, you would expect spending to also grow below trend (the dots will tend to lie in the lower left quadrant).
Both charts show that this is mostly the case, but research (Joint Center for Housing Studies, Harvard 2004) has shown that consumers are willing to spend perceived gains in home equity wealth more quickly than perceived gains in stocks or investments. Possible reasons for this include the fact that home prices are less volatile than stock prices, making home equity gains more “trustworthy” than gains in investment portfolios.
Multiplier effect $1 of increased wealth increases spending by 5.5 cents, but housing wealth is spent far more quickly than stock market wealth. Source: Joint Center for Housing Studies, Harvard University 2004. |
Embrace (or beware) or the wealth effect
By stimulating consumer activity both directly and indirectly, improvements in housing-sector performance would likely have broadly positive implications for both markets and the economy. While industries like materials, construction, and mortgage finance could be specific beneficiaries, the consumer discretionary sector should benefit more broadly.
However, our work has made clear to us that these impacts would not be evenly distributed. Wealth creation associated with homeownership has clearly accelerated in the last 35 years as a function of low/declining mortgage rates and rapid home-price appreciation.
But more recently, the opposite has been true, and recent homebuyers may face a more challenging home-equity profile more familiar to buyers in the early 1990s than those lucky enough — or wise enough — to have purchased a home during the darkest days of the COVID pandemic. That, in our view, has only contributed to the economic bifurcation between haves and have-nots that defines other areas of today’s economy.
The housing wealth effect seems especially germane to 2026
High and rising home prices make consumers feel wealthier by generating gains in “home equity,” which is roughly the difference between what they still owe on their mortgage versus how much they could sell their home for today.
Home equity naturally grows over time because two things happen simultaneously: Homeowners pay down the principal on their mortgages each time they make a payment, and home prices tend to go up over time.
However, it’s not a straight line: Principal payments start out low early in the life of the mortgage (when interest represents a higher portion of the payment) and grow larger toward the end of it; next, home prices don't grow at the same rate year after year (and may even fall from time to time).
The chart below tries to account for these variables by creating a hypothetical population of homeowners who bought their homes in the “decennial” years of 1990, 2000, 2010, and 2020. Then, we ask whether selling that home in year one after purchase, year two, year three ... year 35 would be a “wise” investment decision by calculating a net present value for the associated series of cash flows (with the estimate of home equity during the year of sale representing the “terminal value” in the equation). The steepness of the lines therefore represent how “quickly” homeowners who bought their homes in each of these “decennial” years have built wealth.
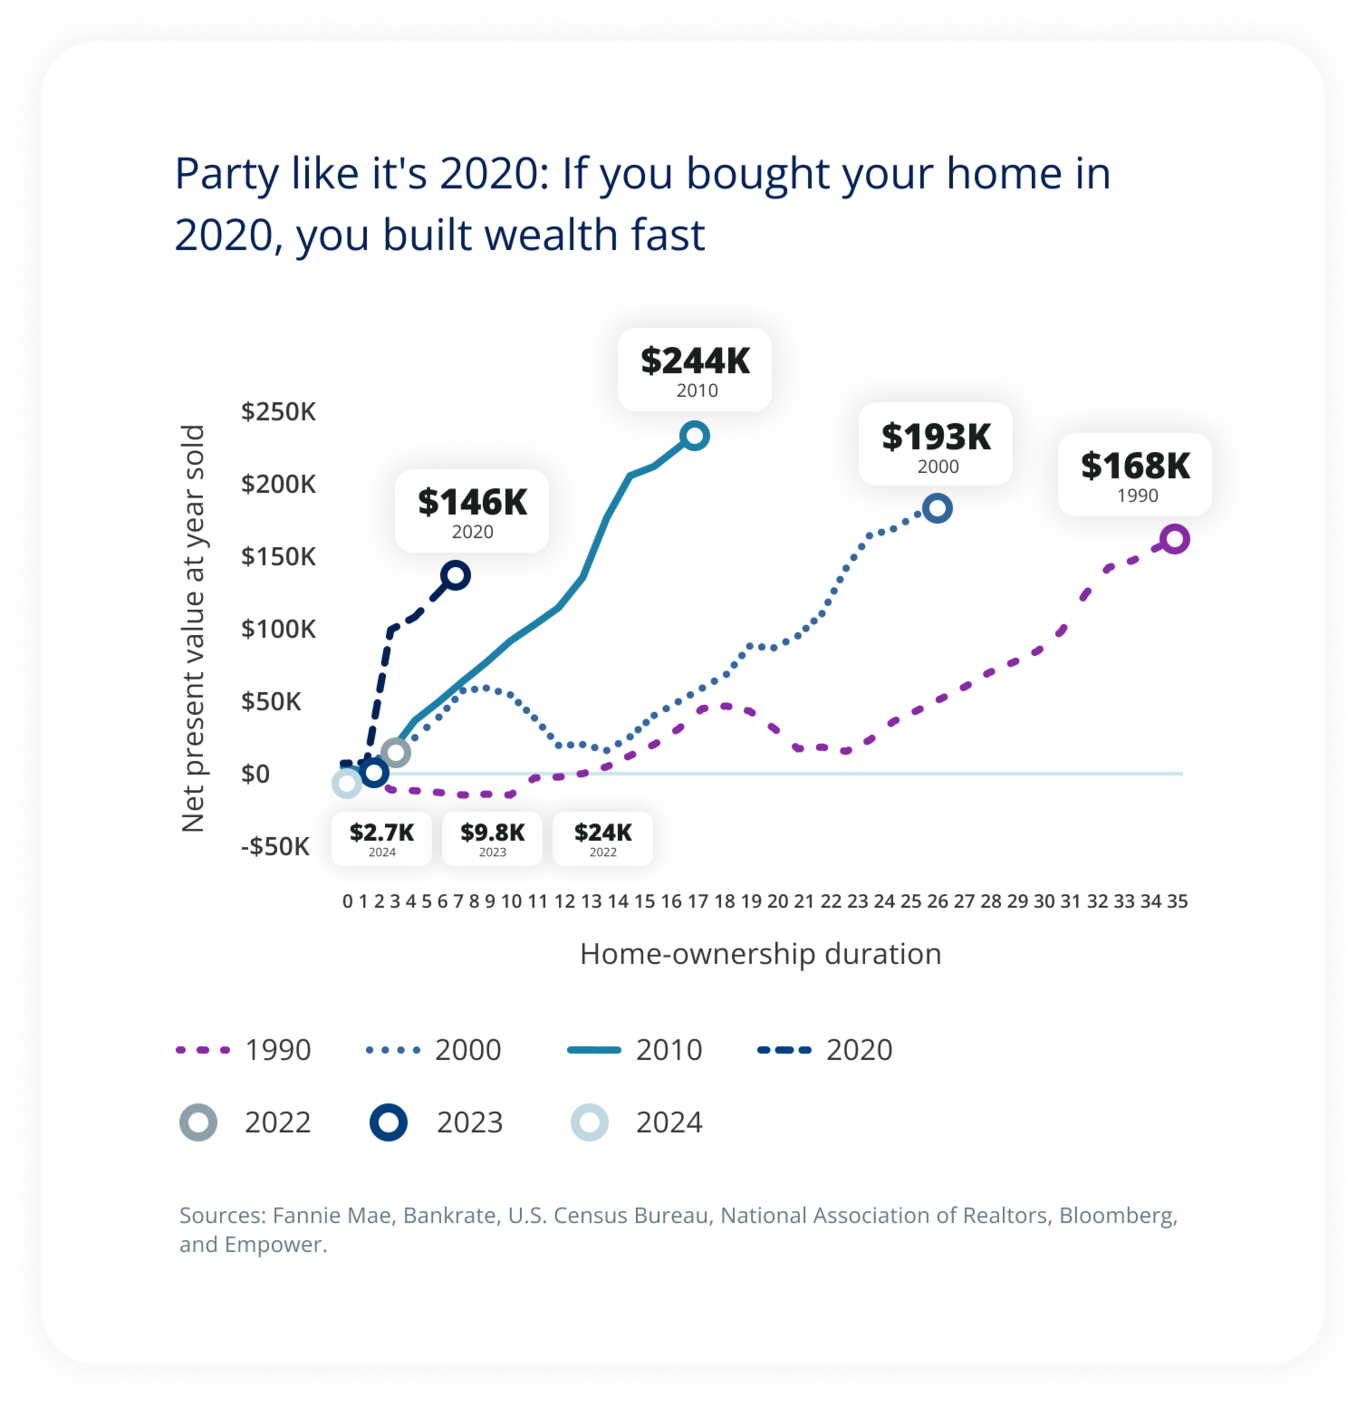
How 'wealthy' you feel as a homeowner is determined in large part by when you buy your home: someone who bought in 2020 has grown their wealth much faster than someone who bought in 1990. More recently, high mortgage rates at the time of purchase and the potential of slower home price growth in the future may keep buyers who stepped in to home ownership more recently from growing wealth as quickly.
As you can see, the experience is quite different depending on when you bought your home: It took more than 30 years for those who bought in 1990 to “build” $150K of wealth, while those who bought in 2010 achieved $150K in about 11 years. For 2020 buyers, they’re already approaching that threshold after fewer than five years.
The reason for these vastly different experiences are primarily differences in how quickly home prices grew over the ownership period, as well as the associated mortgage rates. In 1990, mortgage rates were high and home prices grew slowly, while in 2010-2020, rates were relatively low and home price growth was relatively fast.
So what are the implications for our 2026 outlook? Good news, bad news. We think consumers, particularly high-income consumers, are well positioned to maintain spending given the wealth they’ve gained from home equity, especially in recent years. But over the intermediate term, we don’t see the same tailwind for new home buyers. |
Explore the outlook
Explore the outlook
Overview I Economy I Equity market I Bond market I AI I Housing market I Global debt
The research, views, and opinions contained in these materials are intended to be educational; may not be suitable for all investors; and are not tax, legal, accounting, or investment advice.
Empower and its affiliates are not providing impartial investment advice in a fiduciary capacity to the plan with respect to this material. The plan fiduciaries are solely responsible for the selection and monitoring of the planʼs investment options and for determining the reasonableness of all plan fees and expenses.
Investing involves risk, including possible loss of principal. The opinions expressed in this communication represent the current, good-faith views of Empower at the time of publication and are provided for limited purposes, are not intended as investment or legal advice, and should not be relied on as such. This content is based on the information available at the time of the recording and may change based on more current conditions. Past performance, where discussed, is not a guarantee of future results. Investing involves risk.
This is neither an endorsement of any index, sector, or investment, nor a solicitation to offer investment advice or sell products or services offered by Empower or its affiliates. It is impossible to invest directly in an index. The information presented was developed internally and/or obtained from sources believed to be reliable; however, Empower does not guarantee the accuracy, adequacy, or completeness of such information. Predictions, opinions, and other information contained in this communication are subject to change and without notice of any kind and may no longer be true after the date indicated. Commentary may contain forward-looking statements based on reasonable expectations, estimates, projections, and assumptions. Forward-looking statements are not guarantees of future performance and involve certain risks and uncertainties, which are difficult to predict.
Empower refers to the products and services offered by Empower Annuity Insurance Company of America and its subsidiaries. “EMPOWER” and all associated logos and product names are trademarks of Empower Annuity Insurance Company of America. ©2025 Empower Annuity Insurance Company of America. All rights reserved.
The S&P 500® Index (“Index”) and associated data are a product of S&P Dow Jones Indices LLC, its affiliates and/or their licensors and has been licensed for use by Empower Retirement, LLC. ©2025 S&P Dow Jones Indices LLC, its affiliates and/or their licensors. All rights reserved. Redistribution or reproduction in whole or in part are prohibited without written permission of S&P Dow Jones Indices LLC. For more information on any of S&P Dow Jones Indices LLC’s indices please visit www.spdji.com. S&P® is a registered trademark of Standard & Poor’s Financial Services LLC (“SPFS”) and Dow Jones® is a registered trademark of Dow Jones Trademark Holdings LLC (“Dow Jones”). Neither S&P Dow Jones Indices LLC, SPFS, Dow Jones, their affiliates nor their licensors (“S&P DJI”) make any representation or warranty, express or implied, as to the ability of any index to accurately represent the asset class or market sector that it purports to represent and S&P DJI shall have no liability for any errors, omissions, or interruptions of any index or the data included therein.
©2025 Empower Annuity Insurance Company of America. All rights reserved. INV-FBK-WF-5216770-1125 RO# 4958715-1125