
Capital markets perspective: Technically speaking
Capital markets perspective: Technically speaking
Capital markets perspective: Technically speaking

05.13.2024
Analysis comes in various forms, and using differing approaches can offer insightful perspectives. Within the finance and investing world, technical analysis creates visual ways to analyze data. This approach illustrates the idea that “a picture is worth 1,000 words” and sometimes tells compelling stories.
A quick look at a one-year S&P 500 chart shows that price levels this week ended closer to the all-time highs experienced at the end of March. This broad-based index has nearly reclaimed its peak, which is great news for investors, right?
The positive sentiment may make people happy when they check their 401(k) balance, but it is wise to also consider contrarian perspectives. The S&P 500 was on a stable upward trajectory for a few months but ultimately ran out of steam during the final week of March, resulting in a decrease of approximately -6% in April. As the index once again approaches March’s all-time highs, market participants may consider taking a pause. This is because the late-March price (highs) could be considered a resistance level, which often leads to difficulty in pushing through to the upside. Said another way, if the market deemed prices high in late March and consequently prices sold-off, what will be different this time?
An additional component is the volume of shares traded. Since the beginning of May, daily volume has steadily decreased. This indicates that fewer participants are involved in the day-to-day market and theoretically should offer less confidence in whatever direction the market is moving. As spring turns to summer, I’m reminded of a phrase: “Sell in May and go away.’” Researching multiple forms of analysis is important, and technical analysis indicates that market movement with lower-than-average volume generally doesn’t offer a high conviction of sustainability.
Top 2024 sector performers
As we move through second quarter of 2024, three sectors have outperformed the rest: utilities (+13.55%), energy (+13.42%), and communication services (+12.68%).1 These sectors are often overlooked by the more “magnificent” technology and consumer cyclical sectors, so their year-to-date outperformance warrants a deeper look.
Utilities have swiftly risen during the second quarter to become the best-performing sector to date. Why the sudden jolt? A common metal helps to tell part of the story: copper. Copper can be used as an economic health indicator due to its extensive use in construction, electronics, and manufacturing. Analysts often interpret rising copper prices as a sign of economic growth, as more copper is required for development projects. What is the price of copper now? Copper prices have traded within pennies of all-time highs.2
But wait – could the rallying of utilities signal a problem for the broader equity market?
Utilities shares represent the essence of non-discretionary spending; therefore, they usually outperform in anticipation of an economic downturn. That may not be the case this time, however. Dozens of company earnings releases have given clues during the past few weeks. During their quarterly earnings release, Palantir executives emphasized the pivotal role of artificial intelligence (AI) programs as a growth driver.3 Executives at recently listed Reddit also committed to enhancing the user experience through AI-driven content.4 Nvidia, which did not have an earnings release this week, experienced an increase in value as their price-per-share once again exceeded $900, recovering from mid-April’s downturn. The continued feedback on advancing and incorporating AI throughout the business world is increasing hope that utilities (including metals, such as copper) will benefit from servicing the infrastructure (e.g., data centers) that are supporting the AI boom.5
Lending remains tight
In a useful metric for identifying trends in lending, a recent Federal Reserve survey confirmed banks' willingness to lend has been consistent with recession for roughly a year. The survey attempts to portray lending standards across different banks, calling upon 80 large domestic banks and 24 U.S. branches/agencies of foreign banks. Any easing of standards should be seen as a positive sign for economic growth, but even “unchanged” is restrictive. The latest release continued 2024’s downward momentum, and survey respondents confirmed continued tighter conditions in lending practices.6
Views into the consumer
Although weekly macroeconomic data releases were light, investors had plenty to react to from corporate earnings releases.
Tyson Foods, a large food conglomerate that stocks protein brands like Jimmy Dean and Hillshire Farms in grocery stores, released quarterly numbers that were largely as expected, but it was the company’s comments that caught investors’ attention, primarily that it is seeing a more cautious, price-sensitive shopper.7
Disney released its quarterly earnings while highlighting consumer strengths, but the company made comments to calm expectations. Streaming services Disney+ and Hulu were profitable, but the gains only offset losses from ESPN+. Disney CFO Hugh Johnston said the company has seen "some evidence of global moderation from peak post-COVID travel" at its theme parks. The company delivered domestic operating income of $1.61 billion compared to $1.52 billion in the prior year.8
We’ll include some more quarterly company results in quicker fashion:
- Anheuser-Busch reported 2.6% a revenue increase compared to last year.9
- Shopify slightly beat estimates, reporting $1.86 billion in Q1 compared to estimates of $1.85 billion.10
- Uber reported $10.1 billion in revenue, a 15% increase year-over-year. Bottom-line results posted a loss, largely due to revaluation of equity investments on the company’s balance sheet.11
Money market balances surging
Money market rates have surged, offering the highest annual percentage yield of the past decade. It seems investors have paid attention because asset levels within money markets have reached a new all-time high at just north of $6 trillion.12 That is a large sum of money sitting on the sidelines. It also creates a sense of comfort in the event the economy begins to struggle, knowing that cash is available to tap into. If the Fed continues to hold rates higher for longer, these balances will likely continue to increase from inflows and the compounding effect.
When will the Fed cut rates?
Benjamin Franklin once coined a common phrase: “In this world nothing can be said to be certain, except death and taxes.” One word could be added to Mr. Franklin’s thought: change. Looking back one month ago, market participants were largely optimistic that multiple Fed rate cuts would occur in 2024. Looking at the Chicago Mercantile Exchange FedWatch Tool, the probability of at least one rate cut by June 2024 was over 50%. Fast-forward to this week, that probability has changed and is now overwhelmingly swayed to no rate cut by June.13
What changed?
It may have been a handful of comments by Fed presidents. Richmond Fed President Tom Barkin expressed optimism that current interest rates will eventually curb inflation while reiterating the need for greater confidence in inflation returning to its 2% target before considering rate cuts.14 San Francisco Fed President Mary Daly acknowledged uncertainty in the inflation outlook and suggested a range of possible economic scenarios ahead, stating, “More time is needed for restrictive rates to work.”15 Atlanta Fed President Raphael Bostic remained optimistic about a rate cut this year, although the exact timing is up in the air, with robust job growth. Bostic hinted at a potential easing of rates in September depending on economic conditions, but he maintains that any decision will prioritize careful timing over the extent of rate cuts. As it stands this week, the CME FedWatch tool has a probability that rates will be lower than they are now by December with probabilities of just over 90%.13
What to watch this week
This week will see more inflation data via updated Producer Price Index (PPI) and Consumer Price Index (CPI) readings for April. Inflation has been missing on the high side throughout 2024 as the “last mile” is proving difficult to traverse. At this time, it may not be as much the magnitude of the misses; it’s more the serial nature that has captured the market’s attention. That makes markets more sensitive than they might otherwise be to small misse.
Retail sales is another release on the list. Is the consumer getting burnt out by higher prices? What changes will we see in the data? As we read in a few corporate earnings calls, the consumer outlook is certainly murky and cautionary.
Similarly, earnings season begins to wind down this week, but as always, retailers represent the caboose. Walmart signifies a huge portion of U.S. retail sales, and the company’s commentary could be more insightful than anything we gleaned from Wednesday’s retail sales report. Home Depot also reports this week along with home builder and housing start data. Lastly, we’ll get an updated reading of U.S. leading economic indicators.
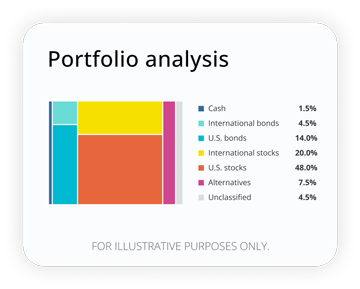
How well are your investments performing?
Analyze your portfolio in minutes and receive a target allocation for your goals.
1 Morningstar Direct
2 https://www.marketwatch.com/investing/future/hg00
3 https://investors.palantir.com/financials/quarterly-results
6 https://www.federalreserve.gov/data/sloos/sloos-202404.htm
7 https://s24.q4cdn.com/507316502/files/doc_financials/2024/q1/Earnings-Release-1Q24.pdf
8 https://thewaltdisneycompany.com/app/uploads/2024/05/q2-fy24-earnings.pdf
9 https://www.ab-inbev.com/investors/results-center
10 https://investors.shopify.com/financial-reports/default.aspx
11 https://investor.uber.com/news-events/news/press-release-details/2024/Uber-Announces-Results-for-First-Quarter-2024/default.aspx
12 Money Market Balances - Money market balances chart - https://fred.stlouisfed.org/series/MMMFFAQ027S
13 CME FedWatch Tool - https://www.cmegroup.com/markets/interest-rates/cme-fedwatch-tool.html
14 https://www.richmondfed.org/press_room/speeches/thomas_i_barkin/2024/barkin_speech_20240506
RO3577603-0524


The content contained in this blog post is intended for general informational purposes only and is not meant to constitute legal, tax, accounting or investment advice. You should consult a qualified legal or tax professional regarding your specific situation. No part of this blog, nor the links contained therein is a solicitation or offer to sell securities. Compensation for freelance contributions not to exceed $1,250. Third-party data is obtained from sources believed to be reliable; however, Empower cannot guarantee the accuracy, timeliness, completeness or fitness of this data for any particular purpose. Third-party links are provided solely as a convenience and do not imply an affiliation, endorsement or approval by Empower of the contents on such third-party websites. This article is based on current events, research, and developments at the time of publication, which may change over time.
Certain sections of this blog may contain forward-looking statements that are based on our reasonable expectations, estimates, projections and assumptions. Past performance is not a guarantee of future return, nor is it indicative of future performance. Investing involves risk. The value of your investment will fluctuate and you may lose money.
Certified Financial Planner Board of Standards Inc. (CFP Board) owns the certification marks CFP®, CERTIFIED FINANCIAL PLANNER™, CFP® (with plaque design), and CFP® (with flame design) in the U.S., which it authorizes use of by individuals who successfully complete CFP Board's initial and ongoing certification requirements.