
Capital markets perspective: Balancing act
Capital markets perspective: Balancing act
Capital markets perspective: Balancing act

03.18.2024
Hotter-than-expected inflation data yielded differing market responses from the bond and stock markets, when the U.S. Bureau of Labor Statistics reported that prices at the consumer level advanced 0.4% in February – not disastrous, and also not that much higher than expected. But core inflation, which attempts to smooth out the data by eliminating things like food and fuel prices, was a little bit more troubling: It, too, was up 0.4%, which turns out to have been a little bit less comfortable relative to expectations than the headline index.1 It also made it much harder to argue that gasoline prices were entirely responsible for pushing the number in the opposite direction of where the Federal Reserve wants it to go.
Bond investors met this inflation data with what felt to me like an appropriate – but not overdone – measure of caution: Yields on both two- and 10-year U.S. Treasury notes rose by around 5 basis points. When you consider that yields only rise when bond prices fall, we can assume that bond investors found something not to like in Tuesday’s Consumer Price Index (CPI) data and sold down some of their exposure to reflect their disappointment. That makes sense: If inflation is showing signs that it might indeed be moving in the wrong direction, then it stands to reason that the Fed might be incrementally less inclined to cut rates in the near future and the economy might have a harder time continuing to grow at above-trend rates as it shoulders still-high interest burdens. Better, then, to move with caution.
Equity markets, though, saw something entirely different: Instead of a more cautious tone, stock investors seemingly cheered that the CPI print wasn’t worse: The S&P 500 and the NASDAQ Composite each rallied more than a percent on Tuesday, placing last week’s CPI day among the 5-6 best days so far this year for both benchmarks.
Now fast-forward to Thursday, and the whole thing repeated itself in the form of producer prices. This time, headline inflation was quite a bit higher than expectations (+0.6%, or roughly twice as high as economists thought it would be2). Even more telling, goods prices rose a substantial 1.2%. That matters, because goods price deflation has been the hero so far during this cycle. If it’s suddenly stalling or running in reverse, it will only get harder for the Fed to regain control.
Bond investors sold off again – two- and 10-year yields rose notably, leaving both rates at their highest levels since last autumn and saddling the Bloomberg U.S. Aggregate Bond Index with its worst weekly performance so far this year in the process. This time equity investors tried to get on the same page, but the selling that took place was somewhat listless; equity investors appear still far less worried than bond traders: The modest to moderate declines booked by most U.S. indices at the end of last week weren’t enough to send U.S. stocks materially lower – large cap stocks, anyway.
So, stocks and bonds seemed to interpret last week’s inflation data quite differently. That’s not necessarily news – bond investors and stock investors see the world through different lenses. There’s nothing wrong with either approach, but it does shed some light on how two well-informed segments of the capital market might view the same set of data differently and therefore react to it in fundamentally different ways. But in my experience, whenever the two camps disagree in such an obvious way, it pays to spend a few minutes trying to work out who’s hitting the mark and who’s taking a shot in the dark.
If inflation was the number one issue on last week’s docket, the consumer was a close second. Retail sales dropped significantly in January, and the figure was revised even lower last week when the Census department released results for February on Thursday.3 As expected, February’s results showed a slight rebound in retail sales, but the gain was less robust than economists had hoped and left open the question of whether the U.S. consumer is wrapping up the post-pandemic spending that has supported growth since the economy reopened. So-called “control group sales” – a subset of retail sales data that excludes a few miscellaneous categories and is used to calculate GDP – flatlined, suggesting that after a few quarters spent supporting growth in a very substantial way, the U.S. consumer is no longer contributing much at all to the U.S. economy’s bottom line, at least for now.
Finally, businesses also faced a somewhat disappointing setup last week. Industrial production ticked slightly higher from a downwardly revised -0.5% in January, while capacity utilization failed to reverse its slide.4
Additionally, small business sentiment weakened again as financial conditions slowly tightened further and profitability continued to slide.5 Meanwhile, the New York Fed’s Empire State manufacturing index resumed its recent habit of surprising to the downside but this time in what might be a more durable decline: Shipments stalled this month, joining new order activity and backlogs – both of which have been weak in recent reports – to argue that a renewed manufacturing recovery may still be a long way off, in at least in that region of the country.6 The parade of regional Fed reports continues this week, suggesting whether the renewed weakness is limited to the northeast, or something a little more broad-based.
What to watch this week
All eyes will be on the Federal Reserve this week, with the regularly scheduled two-day meeting of the Fed’s rate-setting committee convening on Tuesday before Chairman Jerome Powell takes the stage to announce the committee’s decision on rates Wednesday afternoon. The overwhelming consensus is that the Fed will leave rates alone again, which leaves Wednesday afternoon’s post-decision press conference as the only likely source for any additional context. Naturally, post-decision commentary will surround whether the text of the decision itself or anything Powell says in the press conference increases the likelihood of a cut in May (not likely) or June (somewhat more likely but far from a lead-pipe-cinch, at least IMHO).
It’s also possible that the Fed might comment on the banking sector’s exposure to commercial real estate or alter the narrative surrounding efforts to reduce the size of its balance sheet – both of which seem possible to emerge as sources of Fed-related concern beyond just speculation about the direction of rates as we enter the spring and summer months. It’s easy to forget that so-called “quantitative tightening” is running on a parallel track to interest rate policy as another way the Fed is trying to dry up liquidity and cool the economy, and Powell may provide a reminder on Wednesday. Look also to various other Fed speakers on the wires later this week as the quiet period ahead of the rate decision expires.
This week will also bring bunches of housing-related data, beginning the National Association of Homebuilders’ sentiment index on Monday, continuing with housing starts/permits on Tuesday, and wrapping up with existing home sales on Thursday. Together, these three releases will give a fairly comprehensive view of the state of the housing market. Housing matters to the economy for at least two reasons:
-
Housing carries a large “multiplier” with respect to overall economic activity, meaning that a recovery in housing can have an outsized impact on other sources of demand and may even create a virtuous, self-reinforcing pocket of growth.
-
Housing is often viewed as “early-cycle,” meaning that a sustained recovery in housing could be an important signal that the economy is growing in a sustainable way and not tipping toward recession.
Speaking of which, one of this week’s more interesting standalone releases arrives on Thursday: the Conference Board’s Index of Leading Economic Indicators (LEI). For the better part of a year, the LEI’s recession signal was flashing red. That changed last month, with the index indicating renewed faith that growth will continue. On Thursday, we get to see whether the Conference Board’s data is improving, or heading back the other direction toward a change-of-heart.
From a business/industrial point of view, we’ll get flash Purchasing Managers Indices (PMI) from S&P Global on Thursday. “Flash” PMIs are a preliminary mid-month look into where the famously forward-looking purchasing managers’ indices are leaning. Like the LEI, PMI readings were outright recessionary a few short months ago but have now turned more optimistic. In the wake of last week’s disappointing Empire State manufacturing index (as well as the similarly built Philly Fed, due out this Thursday), it’s not hard to imagine the PMIs weakening somewhat.
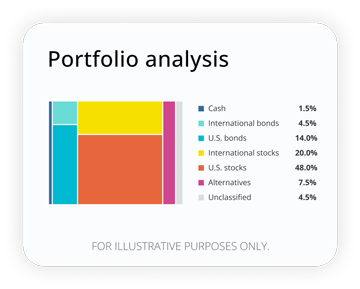
How well are your investments performing?
Analyze your portfolio in minutes and receive a target allocation for your goals.
1 https://www.bls.gov/news.release/pdf/cpi.pdf
2 https://www.bls.gov/news.release/pdf/ppi.pdf
3 https://www.census.gov/retail/marts/www/marts_current.pdf
4 https://www.federalreserve.gov/releases/g17/current/default.htm
5 https://www.nfib.com/surveys/small-business-economic-trends/
6 https://www.newyorkfed.org/survey/empire/empiresurvey_overview
This material is neither an endorsement of any security, index or sector nor a solicitation to offer investment advice or sell products or services.
The S&P 500 Index and S&P MidCap 400 Index are registered trademarks of Standard & Poor’s Financial Services LLC. The S&P 500 Index is an unmanaged index considered indicative of the domestic large-cap equity market and is used as a proxy for the stock market in general. The S&P MidCap 400 Index is an unmanaged index considered indicative of the domestic mid-cap equity market.
Russell 2000® Index Measures the performance of the small-cap segment of the US equity universe. It is a subset of the Russell 3000 Index and it represents approximately 8% of the US market. It includes approximately 2,000 of the smallest securities based on a combination of their market cap and current index membership.
RO3455497-0324


Tom Nun, CFA
Contributor
Tom Nun, CFA, Portfolio Strategist at Empower, works alongside teams overseeing portfolio construction, advice solutions, portfolio management, and investment products and consulting.
The content contained in this blog post is intended for general informational purposes only and is not meant to constitute legal, tax, accounting or investment advice. You should consult a qualified legal or tax professional regarding your specific situation. No part of this blog, nor the links contained therein is a solicitation or offer to sell securities. Compensation for freelance contributions not to exceed $1,250. Third-party data is obtained from sources believed to be reliable; however, Empower cannot guarantee the accuracy, timeliness, completeness or fitness of this data for any particular purpose. Third-party links are provided solely as a convenience and do not imply an affiliation, endorsement or approval by Empower of the contents on such third-party websites. This article is based on current events, research, and developments at the time of publication, which may change over time.
Certain sections of this blog may contain forward-looking statements that are based on our reasonable expectations, estimates, projections and assumptions. Past performance is not a guarantee of future return, nor is it indicative of future performance. Investing involves risk. The value of your investment will fluctuate and you may lose money.
Certified Financial Planner Board of Standards Inc. (CFP Board) owns the certification marks CFP®, CERTIFIED FINANCIAL PLANNER™, CFP® (with plaque design), and CFP® (with flame design) in the U.S., which it authorizes use of by individuals who successfully complete CFP Board's initial and ongoing certification requirements.