
The big trade-off: Americans prioritize new money goals
The big trade-off: Americans prioritize new money goals
The big trade-off: Americans prioritize new money goals

04.03.2024
As higher prices persist, consumers are trading in discretionary spending in a shift toward saving and covering everyday essentials, as February’s Consumer Price Index (CPI) marks a second consecutive month-over-month increase1 and consumer food spend rises 7% year-over-year to $195 per week in February 2024.2
For many, something has to give. Many consumers appear to be making trade-offs between the items they want and the essentials they need – curtailing spend on dining out, clothing, and home improvements, according to Empower Personal DashboardTM data.
Spotlights from the spending slowdown:*
- General merchandise purchases of non-food items dropped 9.1% from January to February
- After a boost in travel-related purchases during the post-holiday season, wanderlust is on the waitlist, as spending decreased 6.2% from January to February
- Dining dollars are also waning, with Americans spending an average of $800/month in February. Eating out has been steadily decreasing month-over-month since July 2023, when spending peaked at $929/month
- Consumers are curbing spend on clothing and shoes to $591/month in February – another spending category trending downwards
- Doers are all done, as home improvement spending tapered off to an average of $481 in February
Slower sales signal a squeeze
Retail sales (excluding volatile categories like gas, autos, and building materials) flatlined in February, missing analyst expectations for a 0.4% gain.3
“February’s consumer spending data leaves open the question of whether the U.S. consumer is finally tapping out of the post-COVID spending spree that has supported growth since the economy reopened,” says Tom Nun, Portfolio Strategist at Empower. “After a few quarters supporting growth in a very substantial way, the U.S. consumer is no longer contributing much to the economy’s bottom line, at least for now."
Overall spending across general merchandise, travel, restaurants, clothing/shoes, and home improvement decreased 3% from January ($4,054) to February ($3,931).
Average spend per user per month

Read more: Wage increases are outpacing inflation, but is that enough?
Not so fast: Some spending categories are too good to go
Still, there are trade-offs Americans just aren’t willing to make. Spoiling furry friends is top among them, with Americans putting an average of $305 a month on their pets and pet care, a 7% increase compared to January.

Spending on streaming services, ticket sales, and sports gambling held steady in February, coming in at $299 a month, on average (nearly flat year-over-year, with $293 in February 2023). Plus, dues and subscriptions to content providers like The New York Times, YouTube Premium, and Apple were all on the up, increasing 11% since January.
Stay current on planning, saving, and investing for life.

Swinging back into saving
The personal savings rate – how much people save as a percentage of their disposable income – was 3.8% in January 2024.4 While still below the long-term average of 8.48%, this savings level shows a modest increase from December 2023 (+0.1%).5
Around half (51%) of older generations and 35% of younger generations Empower surveyed plan to live more frugally in order to achieve financial goals. Empower research also shows investing is a top money goal for the vast majority (80%), with many Americans planning to put more money in stocks (44%), employer-sponsored retirement plans (37%), and high-yield savings accounts (34%).
“With saving account interest rates steadily increasing, consumers have more opportunity to save efficiently,” Nun says. “By being strategic with options like tax-advantaged accounts, high-yield savings accounts, and speaking to a trusted financial professional, they can make significant progress toward short- and long-term goals.”
Read more: How spring cleaning your finances could save you money

Credit card usage (and delinquencies) on the rise
Credit card balances increased by $50 billion, or roughly 5%, in the fourth quarter of 2023, according to a report by the New York Fed.6 Credit card delinquency rates have also spiked to their highest since the Great Recession.7 Transitions to delinquency for both credit cards and auto loans are still rising above pre-pandemic levels.
Share of balances where payments are at least 30 days late

Americans are cutting back on “buy now, pay later” (BNPL) purchases. According to Empower Personal DashboardTM data, the number of consumers using BNPL to fund their purchases dropped 14% from January to February, with total spend per user decreasing 12% month-over-month to $276, on average.
Spending switch-ups between age groups
Spending often varies by age: Older Americans spent 89% more than younger Americans on cable in February, and 68% more on their hobbies.
However, younger Americans are putting a greater share of their money toward charitable giving (+55%), pets (+55%), and home maintenance (+56%). On the flip side, they’re spending substantially less on car-related expenses (-54%) and gas (-30%), as well as electronics (-60%) and personal care (-36%).
Spending differences between age groups
|
Category name |
Americans aged 39 + under |
Americans aged 40 + older |
% difference |
|
Office Supplies |
$270 |
$79 |
242% |
|
Home Maintenance |
$386 |
$169 |
128% |
|
Service Charges/Fees |
$216 |
$115 |
88% |
|
Insurance |
$383 |
$207 |
85% |
|
Charitable Giving |
$211 |
$136 |
55% |
|
Pets/Pet Care |
$293 |
$190 |
55% |
|
Gasoline/Fuel |
$188 |
$268 |
30% |
|
Entertainment |
$268 |
$405 |
34% |
|
Personal Care |
$242 |
$379 |
36% |
|
Automotive |
$321 |
$697 |
54% |
|
Electronics |
$172 |
$432 |
60% |
|
Postage & Shipping |
$66 |
$179 |
63% |
|
Dues & Subscriptions |
$132 |
$380 |
65% |
|
Hobbies |
$114 |
$355 |
68% |
|
Telephone |
$133 |
$589 |
77% |
|
Cable/Satellite |
$101 |
$931 |
89% |
Spending differences between younger (39 and younger) and older (40 and older) Americans in February 2024
Source: Empower Personal DashboardTM data
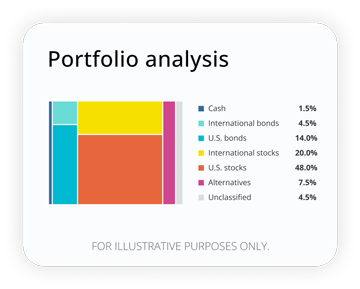
How well are your investments performing?
Analyze your portfolio in minutes and receive a target allocation for your goals.
1 CNBC, “Consumer prices rose 0.4% in February and 3.2% from a year ago,” March 12, 2024.
2 Purdue University, “A monthly consumer survey tracks trends in food demand, satisfaction, food security and other food sustainability behaviors,” March 2024.
3 Financial Times, “News updates from March 14,” March 14, 2024.
4 FRED Economic Data, “Personal Savings Rate,” March 21, 2024.
5 YCharts, “US Personal Savings Rate,” March 21, 2024.
6 Federal Reserve Bank of New York, “HOUSEHOLD DEBT AND CREDIT REPORT (Q4 2023),” February 2024.
7 Axios, “Credit card delinquencies spike, a sign of cracks in the strong consumer,” February 6, 2024.
RO3462817-0324
*Anonymized user data from the Empower Personal Dashboard™ as of March 2024. This data analysis only includes a subset of our free tools users. Following is the list of exclusions: limited to users that logged in in the past year; excludes accounts that are deleted, test, or invalid/bogus.
Asset allocation, diversification, dollar-cost averaging and/or rebalancing do not ensure a profit or protect against loss.


The Currency editors
Staff contributors
The CurrencyTM writers and editors cover the latest financial news and insights shaping how we live, work, and play. The team provides accurate, data-driven, and timely content aimed at empowering financial freedom for all.
The content contained in this blog post is intended for general informational purposes only and is not meant to constitute legal, tax, accounting or investment advice. You should consult a qualified legal or tax professional regarding your specific situation. No part of this blog, nor the links contained therein is a solicitation or offer to sell securities. Compensation for freelance contributions not to exceed $1,250. Third-party data is obtained from sources believed to be reliable; however, Empower cannot guarantee the accuracy, timeliness, completeness or fitness of this data for any particular purpose. Third-party links are provided solely as a convenience and do not imply an affiliation, endorsement or approval by Empower of the contents on such third-party websites. This article is based on current events, research, and developments at the time of publication, which may change over time.
Certain sections of this blog may contain forward-looking statements that are based on our reasonable expectations, estimates, projections and assumptions. Past performance is not a guarantee of future return, nor is it indicative of future performance. Investing involves risk. The value of your investment will fluctuate and you may lose money.
Certified Financial Planner Board of Standards Inc. (CFP Board) owns the certification marks CFP®, CERTIFIED FINANCIAL PLANNER™, CFP® (with plaque design), and CFP® (with flame design) in the U.S., which it authorizes use of by individuals who successfully complete CFP Board's initial and ongoing certification requirements.