
Research spotlight: Affordability
U.S. economic and market outlook 2026
Research spotlight: Affordability
U.S. economic and market outlook 2026
Research spotlight: Affordability
The affordability angle: How bad is it, really?
It’s a midterm year, and that makes all things economy loom large
And when it comes to the economy, affordability tops the list. We all have our favorite anecdotes — Am I really paying this much for eggs?! — but what does the data tell us?
We dug in across five essential categories: housing, food, transportation, apparel, and healthcare.1 We looked at inflation over the long term (since 2015) and shorter periods (2020, 2022, and 2025). We also looked at what we call “wallet share,” or the share of total expenditures consumers are spending on these categories.2 And, of course, we tracked the “feels,” courtesy of surveys like the University of Michigan sentiment survey, while noting proposed policies for different categories.
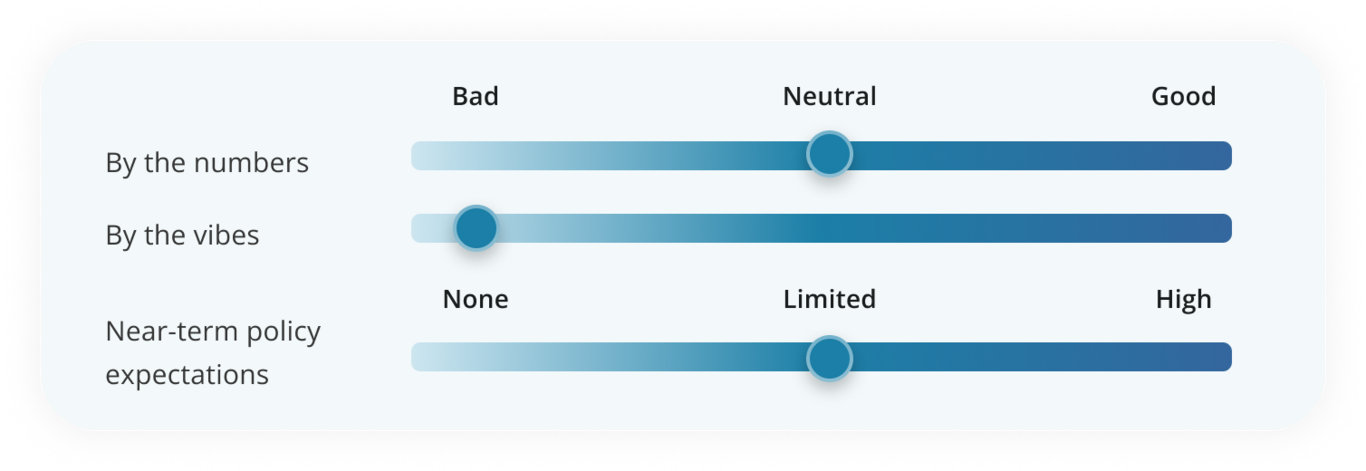
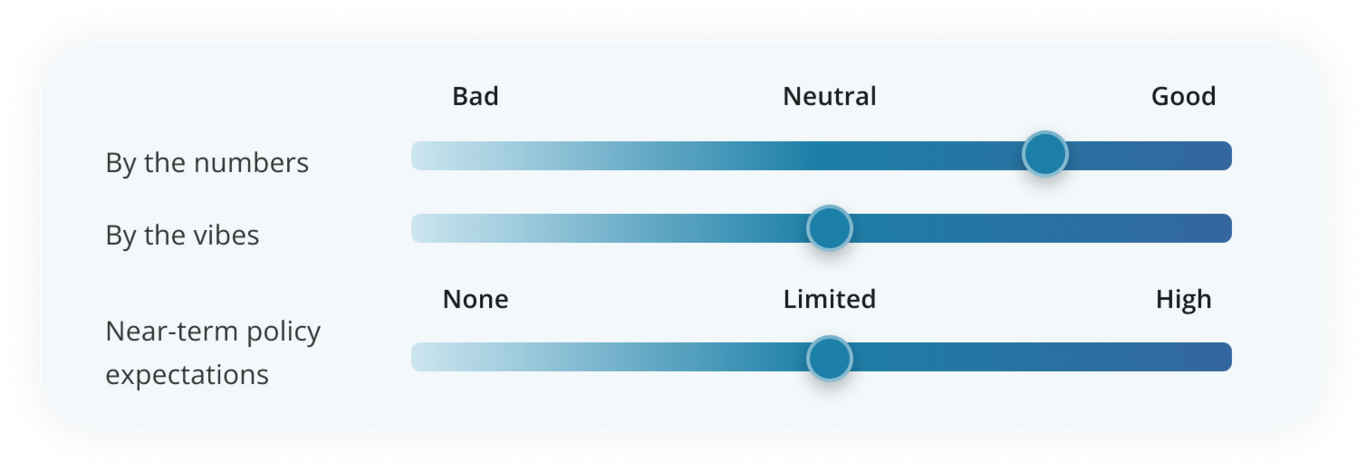
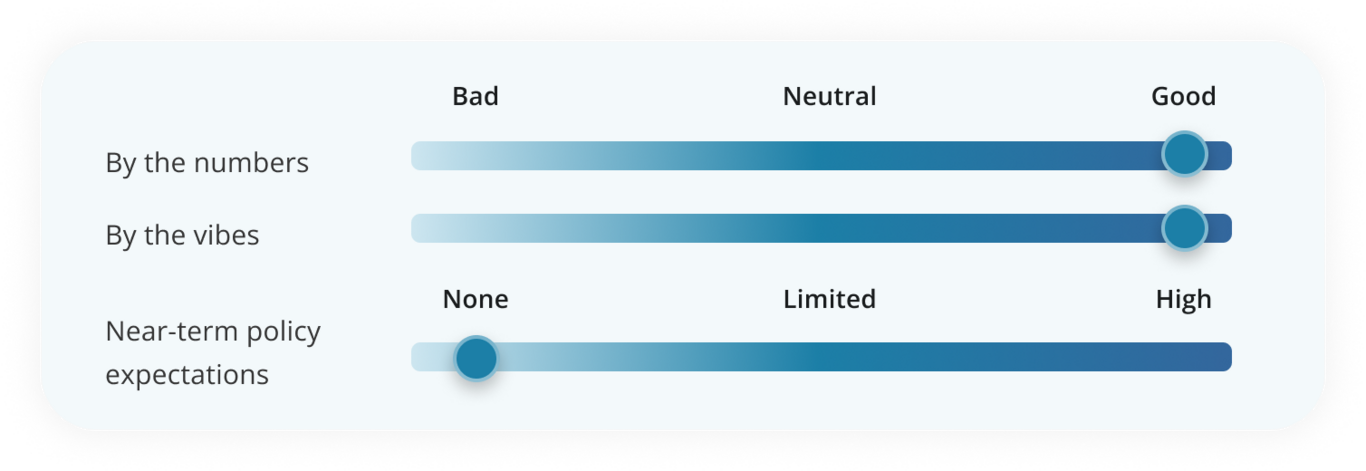
What we found: The feels are worse than the numbers. In fact, many of the numbers were surprisingly benign over the long term. |
So why the bad vibes? A few theories.
First, the rate of inflation has slowed since 2022, but the price level hasn’t returned to what it was (and probably never will).3 Relatedly, while the long-term and near-term numbers are largely benign, the relative growth of expenditures for the period from 2020 to 2024 was painful and likely won't be soon forgotten, regardless of how conditions have improved since. And finally, while income has grown more than the wallet share for these essentials over the long term, consumers aren’t confronted with income each time they go to a restaurant or pay for their groceries. What they see is the bill.
One additional point. While the aggregate picture is better than one might guess, there are some areas of affordability — like homebuying — that are both pretty bad, number-wise, and really hard to ignore.
We get into all the details below, along with an outlook for each section and the potential economic or market implications.
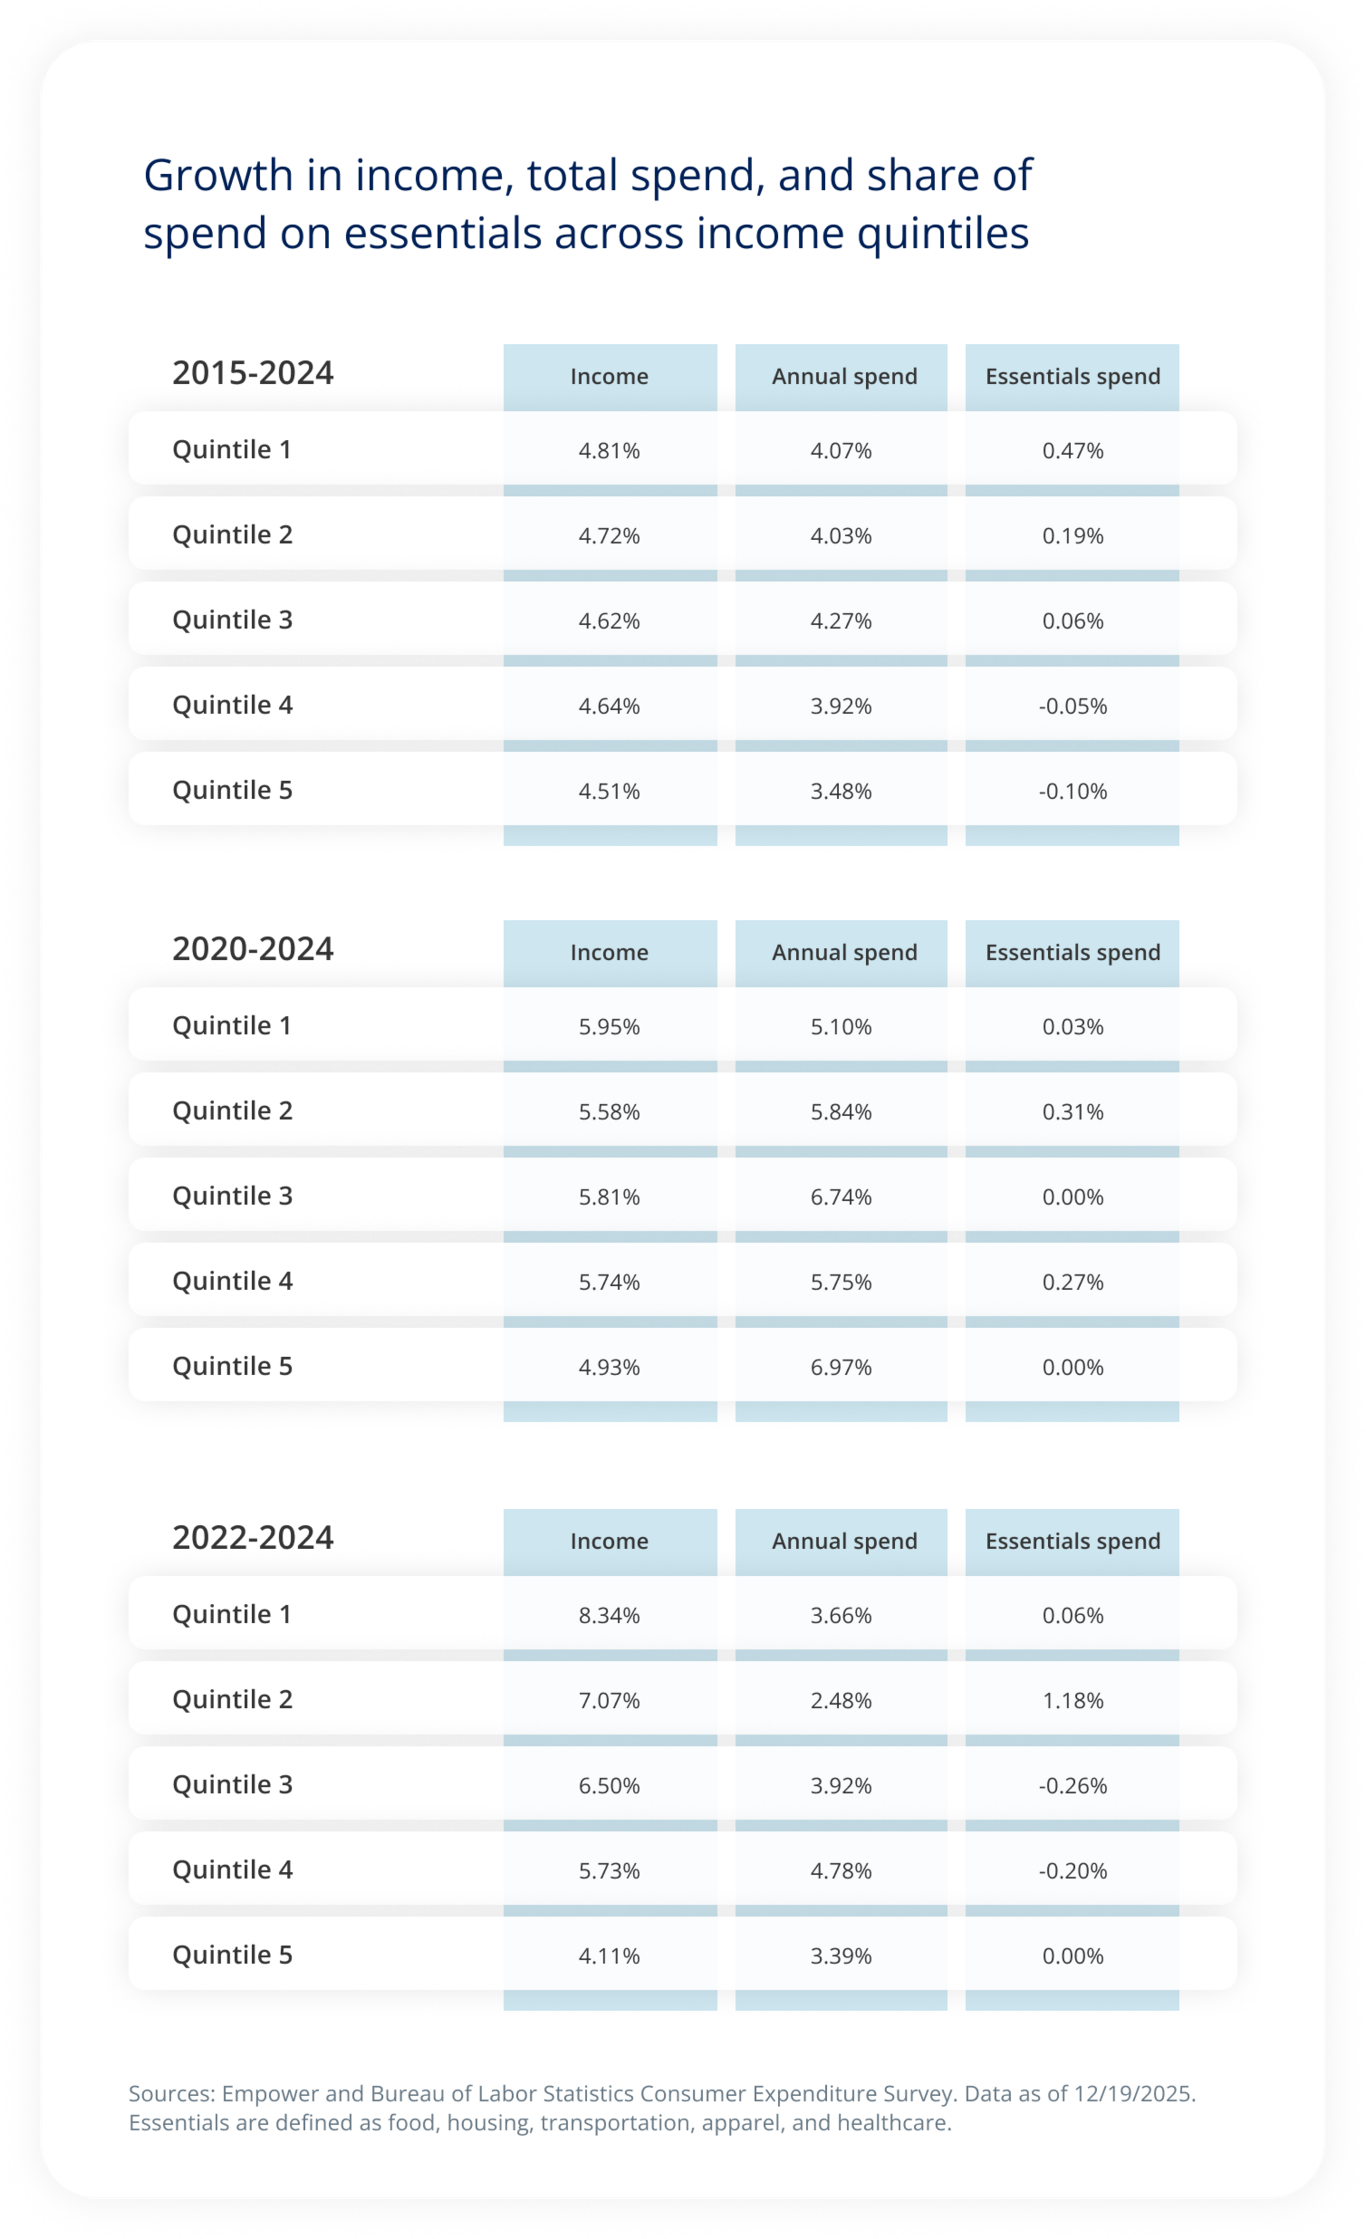
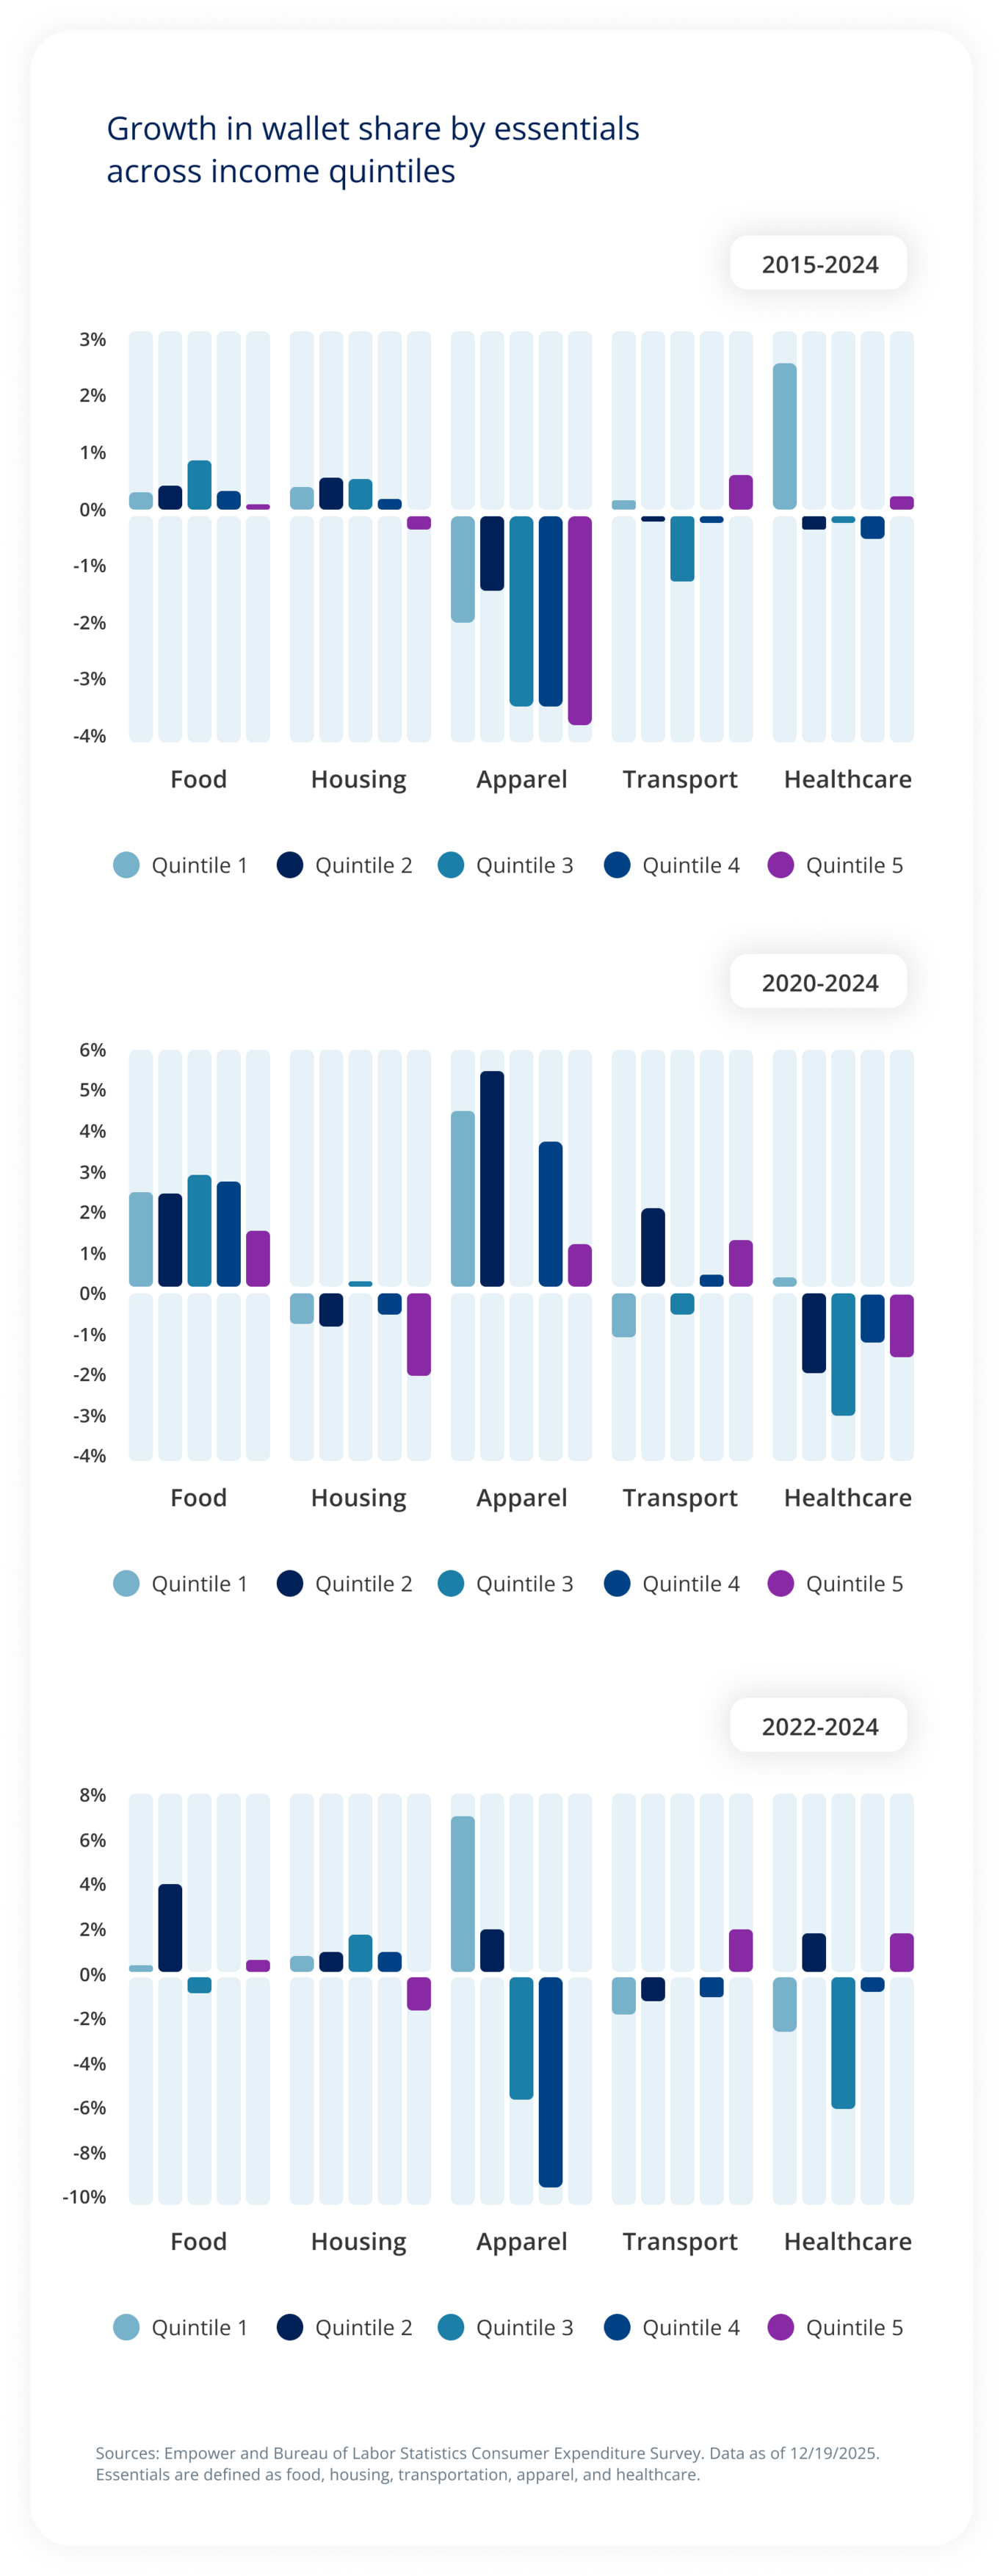
Sources: Empower and Bureau of Labor Statistics Consumer Expenditure Survey. Data as of 12/19/2025. Essentials are defined as food, housing, transportation, apparel, and healthcare.
Sources: Empower and Bureau of Labor Statistics Consumer Expenditure Survey. Data as of 12/19/2025. Essentials are defined as food, housing, transportation, apparel, and healthcare.
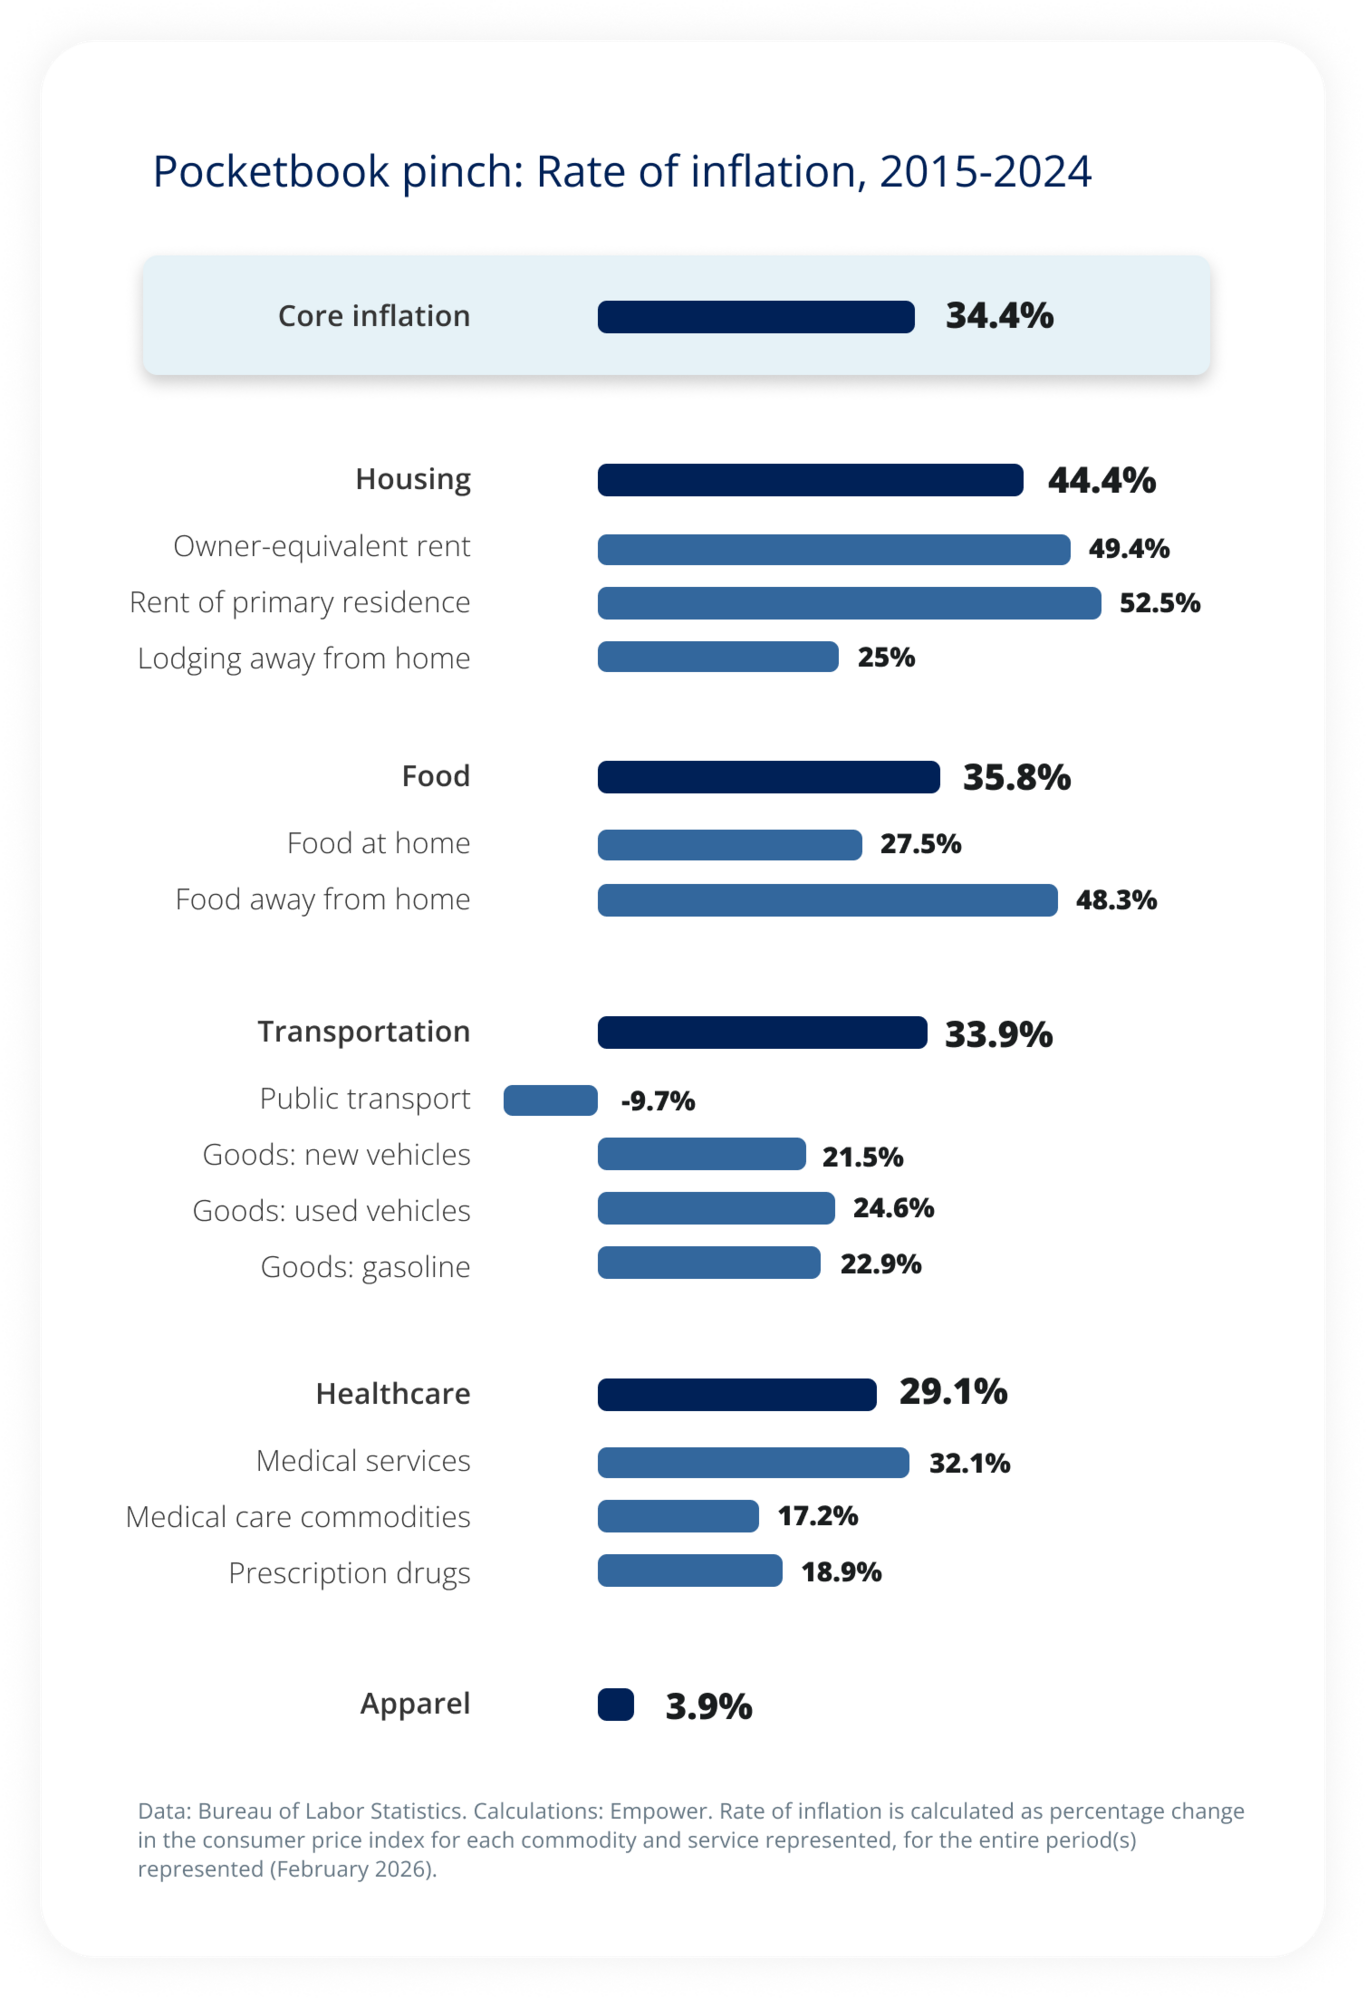
Data: Bureau of Labor Statistics. Calculations: Empower. Rate of inflation is calculated as percentage change in the consumer price index for each commodity and service represented, for the entire period(s) represented (February 2026).
Housing
Conditions
Since 2015, housing and related costs — which include not only rent and mortgage but also things like utilities, electricity, and furniture — have experienced only a slight move higher as a percentage of annual expenditures (wallet share) for U.S. consumers. That’s in spite of the rapid growth in rent and home prices that has outpaced overall inflation.
But there is still an affordability concern. The massive home price appreciation has created a truly staggering amount of wealth for homeowners, but it has also shut the door on many Americans who would like to buy a home. Meanwhile, we've seen upward pressure on rents until only very recently.
Vibes
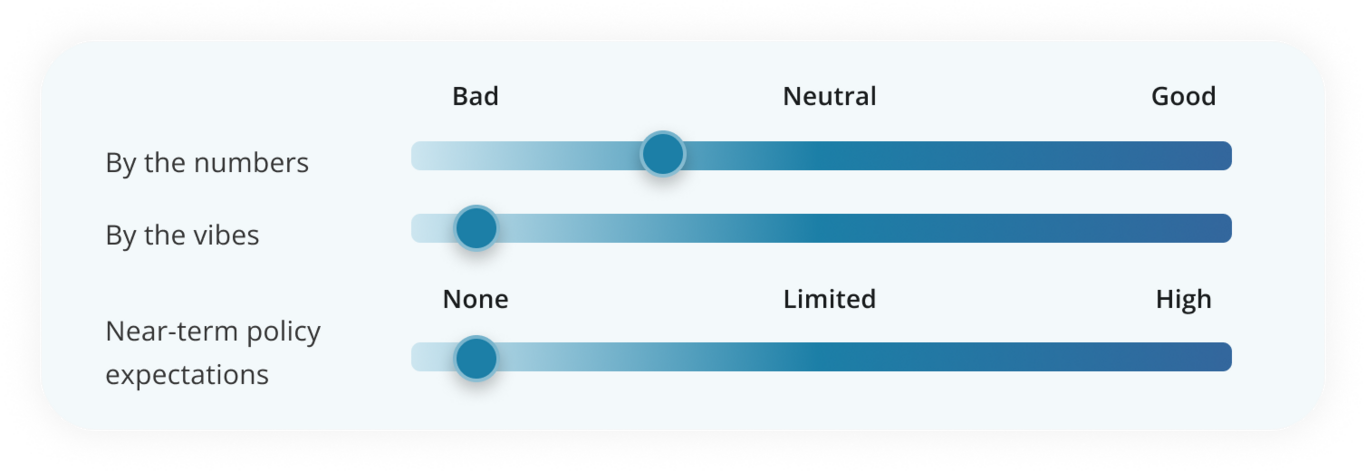
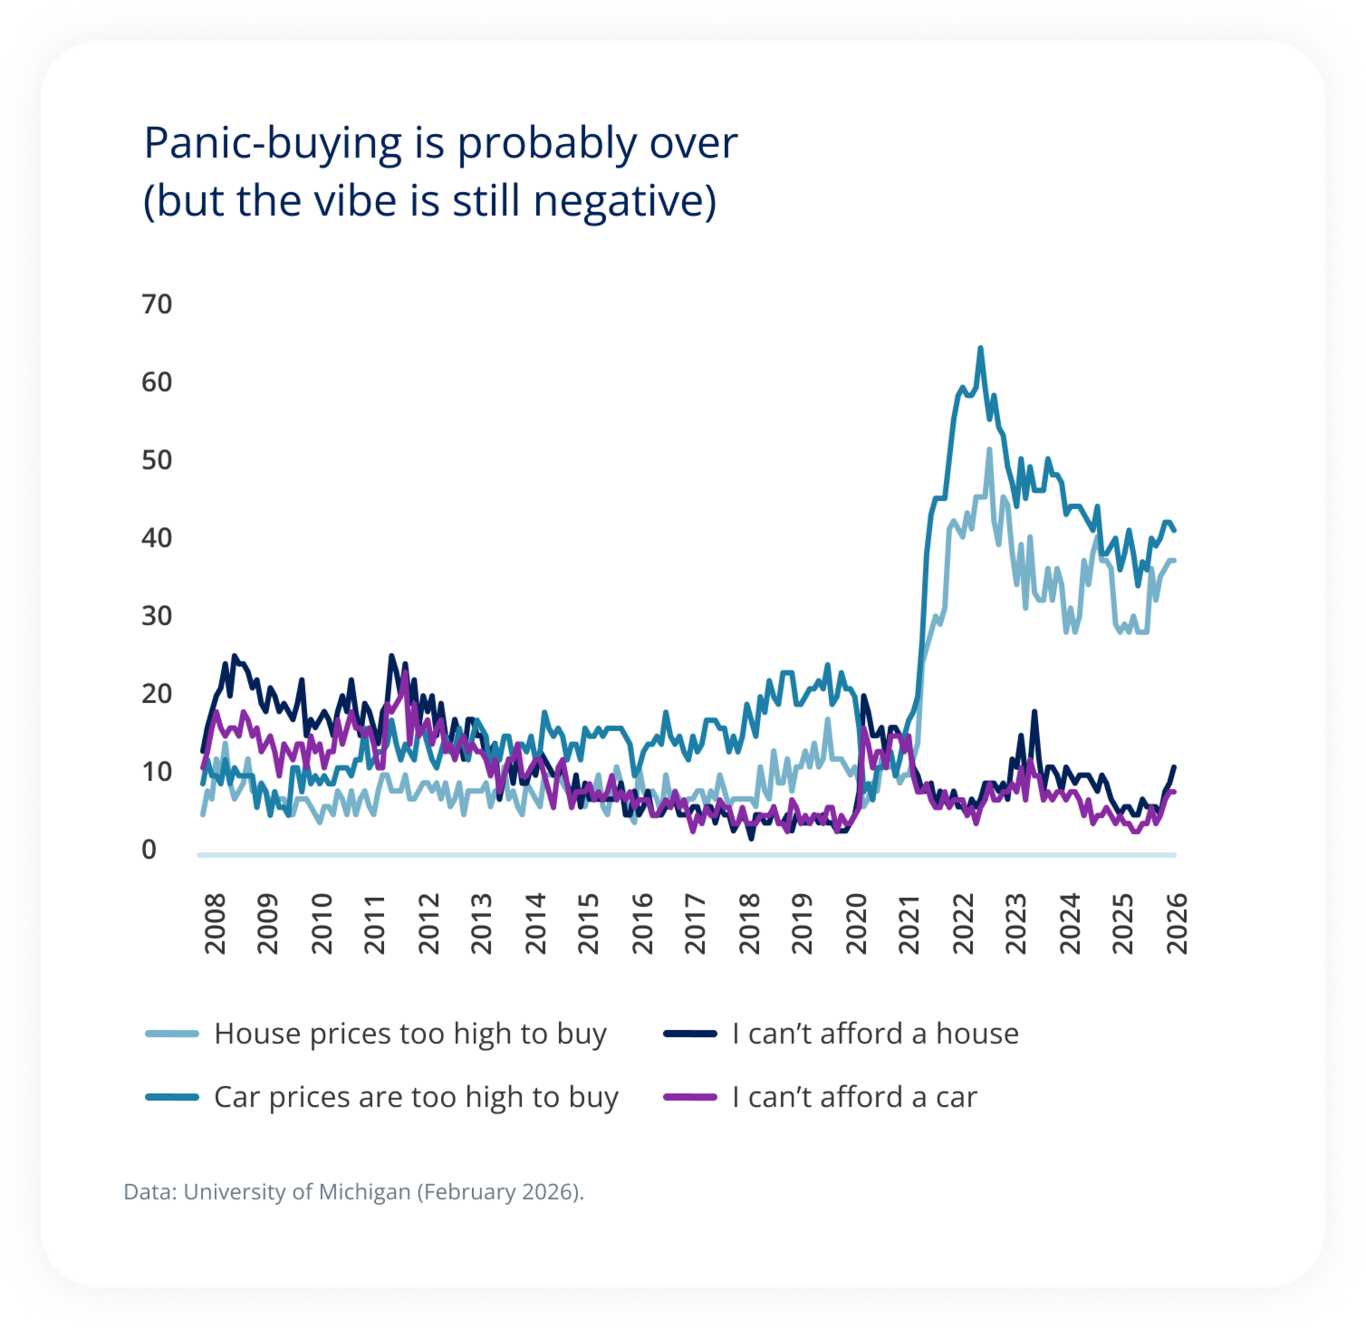
Bad. Not only for homes, but also big-ticket items like household appliances. The risk that “panic buying” might have ignited an inflationary spiral has receded, but the percentage of consumers who view prices as “too high to buy” (or plainly can’t afford to buy) is high and rising.
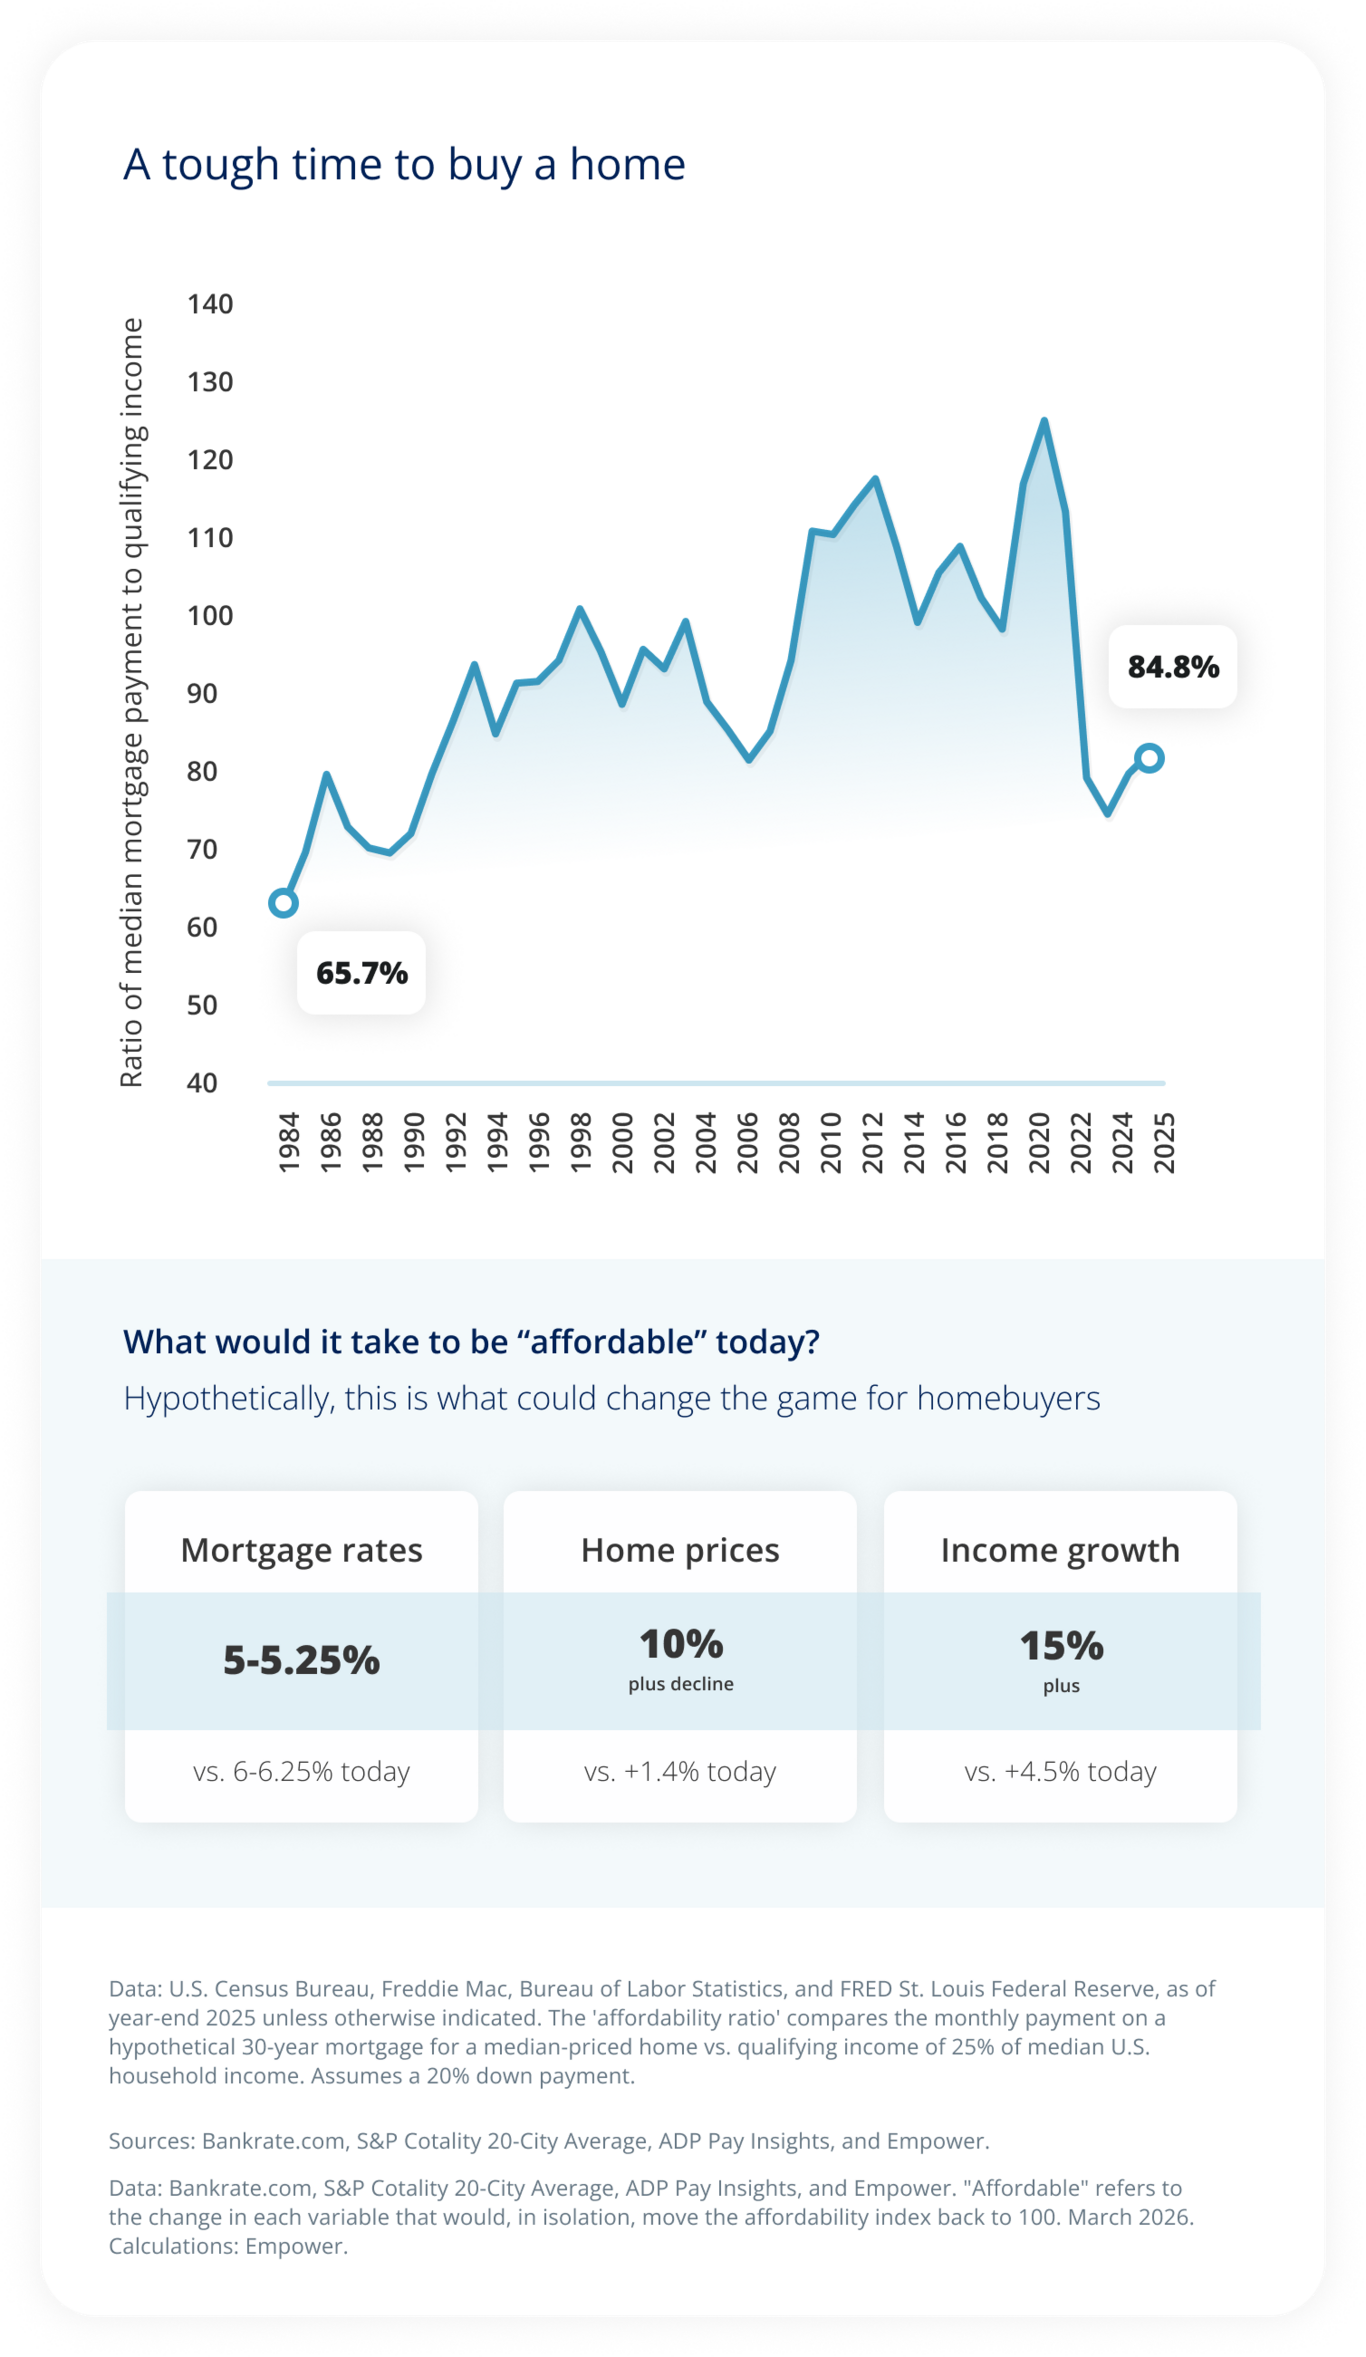
What would it take to be “affordable” today? Hypothetically, this is what could change the game for homebuyers
Policy
At least three policy initiatives have been proposed at the federal level, including a ban on large institutional ownership of single-family homes, mandated buying of mortgage bonds by government-sponsored enterprises (GSEs) (Fannie Mae and Freddie Mac) intended to apply downward pressure on mortgage rates, and incentives designed to encourage local and state governments to ease building codes and restrictions.4
However well intended, two of these three policies require cooperation of Congress, coordination with other areas of the administration, or years to create meaningful impact. Thus, we see no 2026 silver bullet here.
Outlook
We believe modest improvement in home affordability in 2026 is possible: Mortgage rates have edged lower, and for-sale inventory has improved.5 However, we view a meaningful correction in home prices as unlikely given the chronically under-supplied nature of the U.S. housing market. Without it, our research suggests we may not reach normal levels of affordability for another two to three years.
Ominously, the rate of inflation for electricity spiked in 2025.6 Given concerns around AI demands on the power grid, this is a place we will continue to watch. |
Implications
The housing market unquestionably has a sizable cyclical impact on the economy. It influences the wealth effect7 and therefore consumer spending. Homebuilding activity tends to drive economic activity across labor, commodity, and consumer markets.
At the moment, the housing market’s impact on the economy and markets is mixed due to the conflicting wealth effect and home affordability. Meanwhile, homebuilding activity remains muted,8 suppressing all the economic juice that comes with it until affordability improves.
Food
Conditions
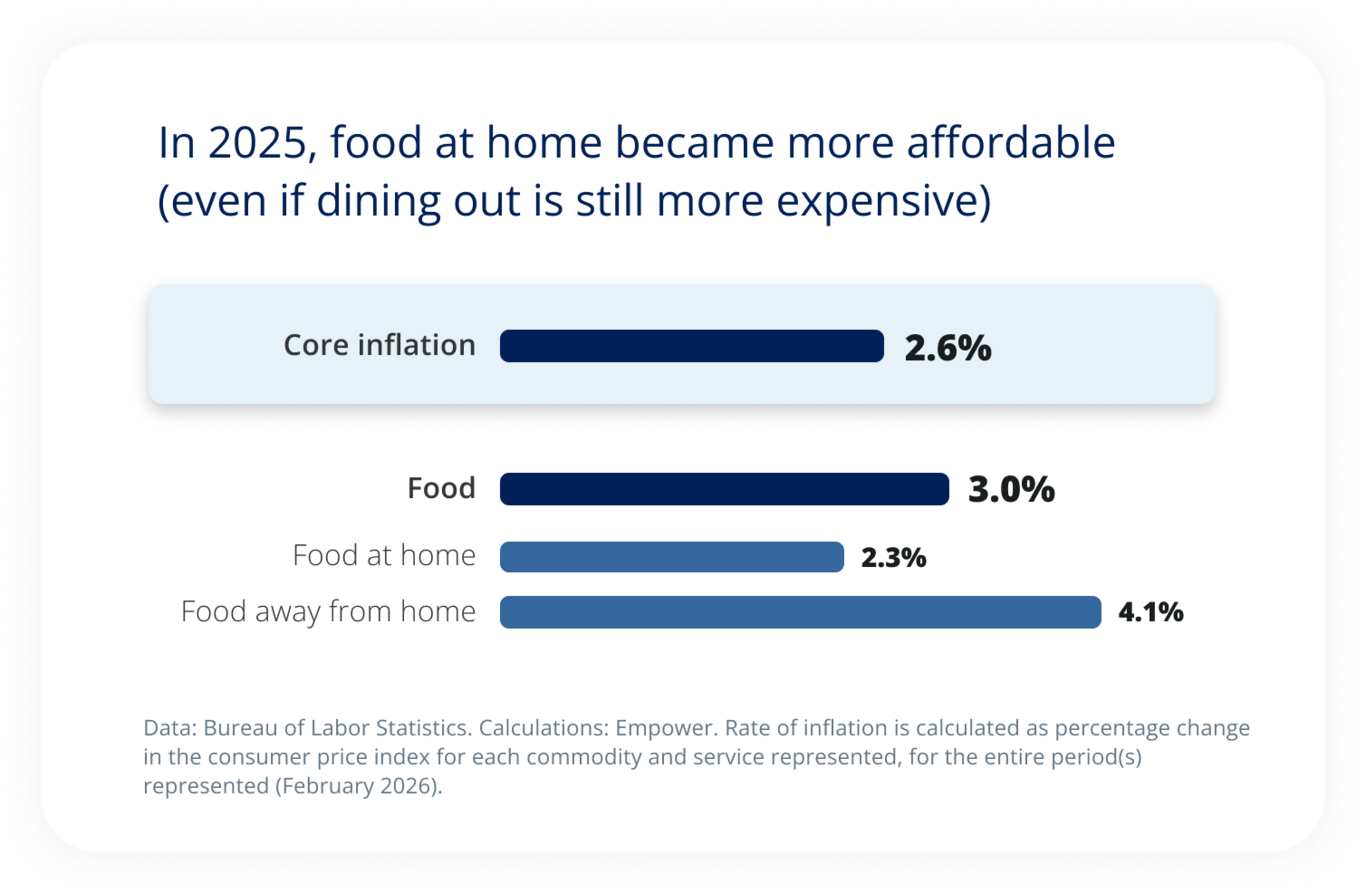
Food costs rose meaningfully during the post-pandemic inflation surge and only recently returned toward rates that approximate broader core inflation. The surge was (and still is) uneven, however, with the cost of food consumed away from home rising faster than the cost of food prepared at home. This likely reflects rising wage and operating costs for restaurants.
We see the reverse trend in the wallet share: Across all income quintiles, food at home now consumes a larger share of expenditures than it did in 2015.9 However, the opposite is true for food consumed away from home. In fact, we see a decrease across all income quintiles since 2015 (note that the share of expenditures spent at restaurants has skyrocketed since 2020, reflecting the widespread shutdowns during the pandemic). The longer-term trend doesn't mean dining out is cheaper than it was in 2015 — data strongly suggests otherwise.
But it does suggest consumers have spent less money on the category overall.10
Interestingly, for food as an aggregated category, the share of annual expenditures has moved higher but not markedly so. However, because food represents a meaningful percentage of the U.S. consumer’s budget — the share typically ranges from 11% to 16% — even modest increases in price can have a big impact on budgets and consumer perception.
Data: Bureau of Labor Statistics. Calculations: Empower. Rate of inflation is calculated as percentage change in the consumer price index for each commodity and service represented, for the entire period(s) represented (February 2026).
Vibes
Bad. High food prices get a lot of attention in the media, especially around elections. Recent data from the Conference Board suggests consumers believe higher inflation at restaurants will persist.
Policy
Likely, no silver bullet here, either. While politically seductive, the idea of price controls ignores significant volatility in commodity prices that serve as foodstuff inputs as well as the very slim margins faced by farmers, grocers, and other members of the supply chain — many of whom are already heavily subsidized. Previous attempts have created negative side effects such as shortages or have been met with outright failure.
Outlook
In 2025, food price inflation largely returned to trend. While the cost of food consumed away from home continues to outpace that for home-cooked meals, more moderate wage growth among leisure and hospitality workers — together with a continued substitution effect that has kept the category’s wallet share in check — should help reverse that trend.
Implications
An economic consequence of higher food costs could be lower discretionary spending/saving. However, it seems consumers across income quintiles may have largely kept their food budgets consistent by limiting their spend on food away from home. That perhaps weighed on the restaurants but otherwise softened the impact of declining food affordability on the overall economy.
Transportation
Conditions
Transportation spending spans a wide range of categories, including vehicle purchases, maintenance, insurance, fuel, and public transportation. On the whole, transportation has consumed less consumer wallet share since 2015, but the effects vary widely across the types of goods and services being consumed.
Not surprisingly, a “pandemic effect” — inflation resulting from the sudden stop of COVID — is obvious in big-ticket categories like purchases of new and used cars, but in many cases this represented simply a pull-forward of demand that tends to wash out over the longer term. Public transportation — a sub-category that includes passenger air service — is an exception: It increased across the board, perhaps reflecting the “revenge travel” boom following COVID shutdowns.
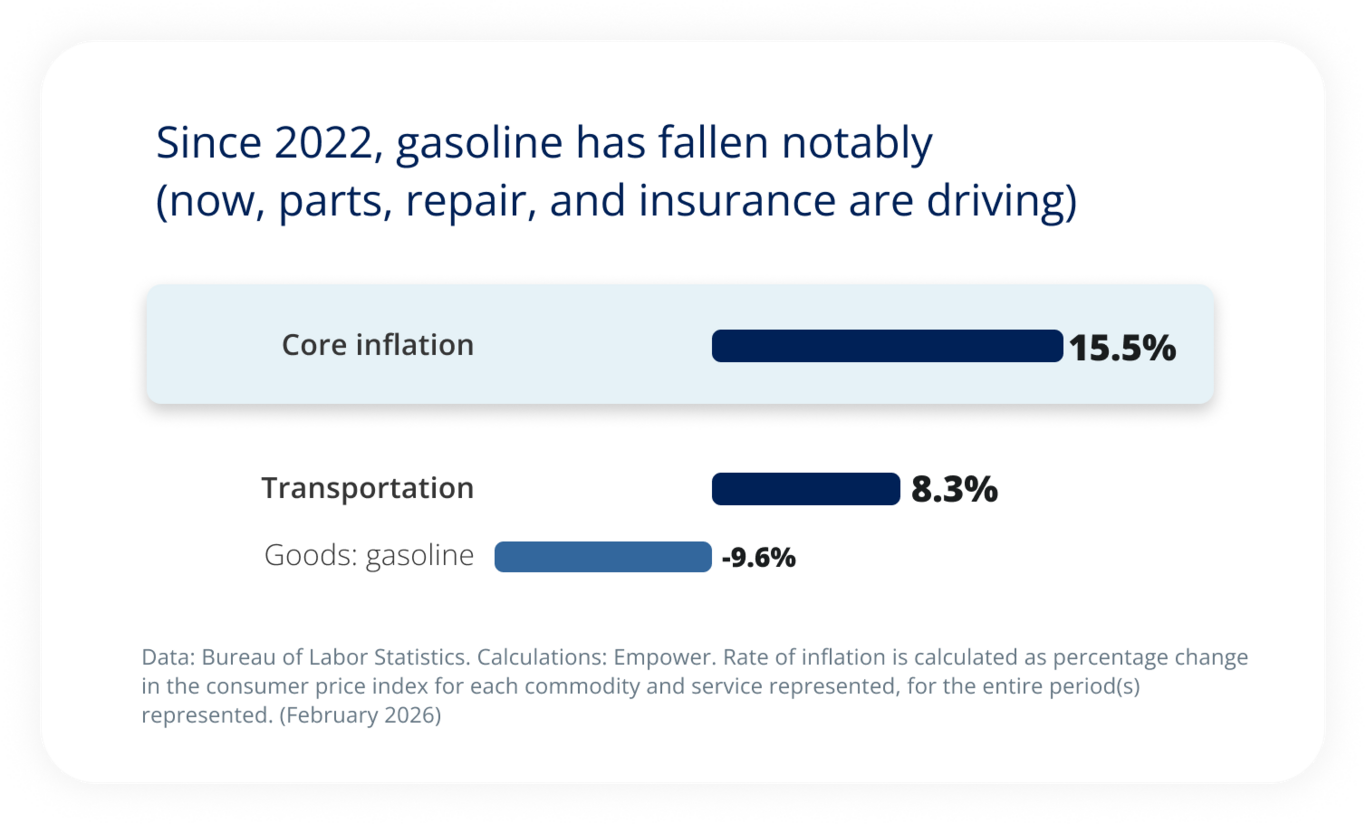
One of the most-watched areas — gasoline — has seen a notable fall from 2022 levels, even as the Iranian conflict threatens to change that. This has a big impact on sentiment because gas is a regular and highly variable cost across income quintiles.
Vibes
Good and bad. Gasoline prices had fallen, though they are on the rise again (more on this below). The bad: Like housing, “panic buying” is no longer a threat for vehicle prices, but for those who view prices as too high to buy (or simply can’t afford to buy), the price is stubbornly high.
Policy
As part of an affordability push, the Trump administration has introduced permitting reform to speed up approval of oil and gas leases and lifted drilling restrictions on federal lands. Meanwhile, an extension on limited tax-deductibility of interest paid on auto loans for the purchase of domestically built vehicles aims to help reduce the cost burden of purchasing a new vehicle, even as tariff policies work at cross-purposes to that goal.
Outlook
We wouldn’t expect the budget burden represented by transportation spending to ease significantly in the near term, nor would we expect it to worsen materially over the longer term.
That said, geopolitics and global supply/demand dynamics exert significant influence over prices paid for transportation, particularly fuel. Now, it’s true that the shale revolution and the U.S.'s new status as the world’s largest oil and natural gas producer11 should grant the U.S. economy a measure of insulation; the promise of a revival in production from Venezuela is also an incremental positive.
Still, recent events in the Middle East mean that, at least in the near term, gas prices face new price pressure, particularly if sustained durable economic growth keeps demand intact for airfare, cars, and travel.
Implications
Due to generally inelastic demand, consumers across income quintiles feel the volatility in gas prices, for better or for worse. And when it is for worse, the punishment is likely greater at lower-income quintiles. So, today, we’re looking at a double-edged sword, with the gains from the past year offering some relief, and the near-term supply shock undoing some of that progress.
Healthcare
Conditions
A seemingly unmovable cloud hangs over the healthcare sector. Costs here include insurance, medical services, drugs, and medical supplies, and sentiment across the board is challenged by the unpredictability of costs and a perception of runaway expenses.
However, as we look back at data from 2015 to 2024, most income quintiles saw their share of healthcare spend remain largely static on a point-to-point basis, with the exception of the lowest income quintile. There, consumers spent more across all subcategories within healthcare — with increases in medical services and medical supplies especially acute.
From an inflation perspective, it’s notable that healthcare costs have actually tended to run at — or even slightly below — core inflation in recent years. However, consumer experience can be heavily influenced by things like subsidies, which aren’t necessarily well represented in reported data.
Vibes
Bad. As with food, elections tend to keep drug prices front-of-mind for consumers. More than one in five consumers think they’ll be paying more for medical care in the next six months than they did last year.12
Policy
As has been generally the case for most administrations, healthcare sits squarely in the Trump administration's crosshairs. Current initiatives aimed at reducing drug costs include “most-favored-nation pricing” and trumprx.gov, a platform designed to reduce drug costs for the uninsured and those with high-deductible plans. Other proposals include direct-to-consumer reimbursement of Affordable Care Act (ACA) subsides and changes in Centers for Medicare & Medicaid Services (CMS) reimbursement rates, efforts designed to make insurance more competitive and fiscally less burdensome.
Outlook
Healthcare spending tends to be relatively inelastic, meaning that future affordability will be driven by how quickly healthcare costs are rising relative to other prices in consumer budgets. It’s therefore notable that drug price inflation — understandably the target of the administration’s most robust initiatives so far given their visibility — have been relatively tame during this episode. Efforts to slow medical services inflation, which is currently running above core inflation, are important to improving healthcare affordability.13
Implications
As with other categories, lower healthcare costs may support greater discretionary spending or savings. From the policy perspective, there’s a potential market impact to consider. Unlike other areas in our affordability study, healthcare is among the largest sectors in the Bloomberg 500 Index. Changing regulations that impact business models could have a bigger impact on the broader market, for better or for worse.
Apparel
Conditions
Apparel is one of the few areas within our study where affordability has unequivocally improved. Across all income quintiles, the share of expenditures going to apparel has fallen since 2015. Of course there was a pandemic effect here; the share of expenditures spent on clothes plummeted in 2020 and so accelerated in the years since, but that’s been a result of normalization rather than a change in affordability.
Inflation numbers tell a similar story: Price growth in apparel has been consistently below core inflation since at least 2025.
Vibes
Good. Apparel is one category where price growth has been tame, and there is little reason we expect that to change.
Policy
No policies under discussion.
Outlook
We see little reason for either affordability or wallet share to change significantly here. Return-to-office initiatives seem to have stabilized around a new normal that at least partially embraces hybrid work, meaning that demand for apparel — and therefore price and wallet-share growth — may remain constrained.
Implications
Apparel accounts for a marginal share of annual expenditures across all income quintiles; numbers range between 2% and 3%. Thus, while lower — or higher — prices would of course matter, fluctuations here don't necessarily change the spending patterns or the sentiment of U.S. consumers.
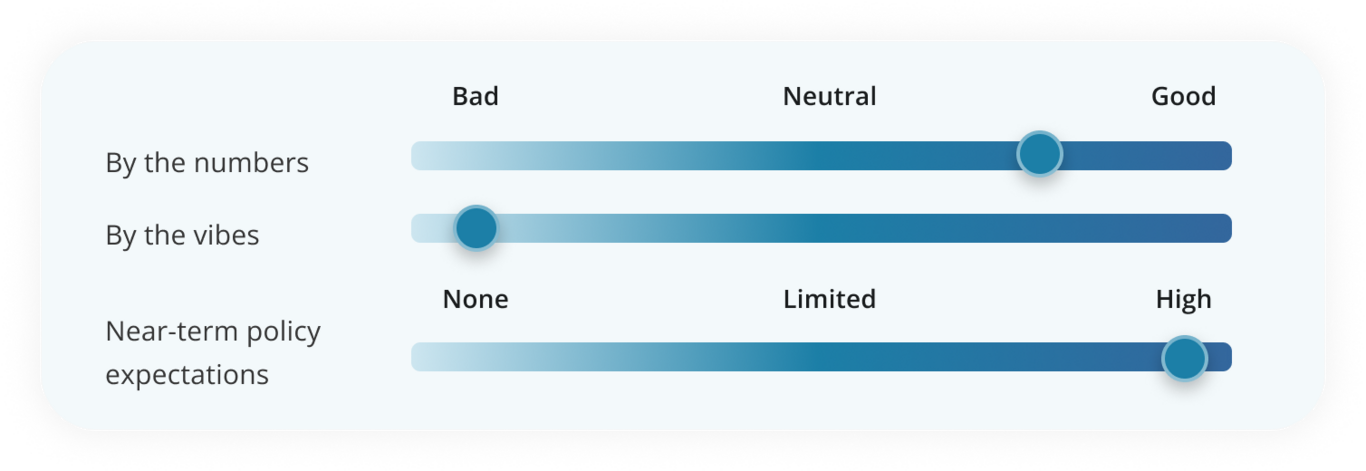
Our biggest takeaway: The numbers may be better than what people think, but changing the vibes is likely going to be hard — particularly for federal policy, which rarely acts as a quick fix. |
Explore the Q2 outlook
Explore the Q2 outlook
Explore the outlook: Overview » Research spotlight: Affordability»
Stay up-to-date |
Investment Insights
1 Our affordability study is based upon the Consumer Expenditure Study by the Bureau of Labor Statistics. This study was last updated on December 19, 2025. In particular, we evaluated data from Table 1101: Quintiles of income before taxes: Annual expenditure means, shares, standard errors, and relative standard errors, Consumer Expenditure Surveys for years 2015 – 2025. We also evaluated the Consumer Price Index from the Bureau of Labor Statistics to assess price changes and the Surveys of Consumers from the University of Michigan for a review of current sentiment. Unless otherwise noted, all analysis in this study comes from one of these three sources.
2 To evaluate wallet share, we looked at the shares of total expenditures by income quintile as reported by the Bureau of Labor Statistics. We make a few caveats to our analysis. First, the Bureau of Labor Statistics will occasionally update its categories, making comparisons across time periods for select line items difficult. However, we do not think this is a major concern for the categories we evaluated. Second, a range of factors can influence wallet share over time. For example, income levels can move higher, but spending remains the same, reducing the wallet share but not the aggregate dollars spent. Here’s another example: Higher costs in one area of consumer spending could also crowd out spending in a separate area, shrinking wallet share as a result. We noted this possibility in our study of food wallet share, but we did not conduct an exhaustive statistical study for this consideration or that of other changing variables.
3 Bureau of Labor Statistics. Data as of March 11, 2026.
4 whitehouse.gov, January 20, 2026, Reuters, January 9, 2026, Bipartisan Policy Center, March 10, 2026.
5 Bloomberg, March 12, 2026.
6 Bureau of Labor Statistics, March 10, 2026.
7 The wealth effect is the economic theory that says consumers spend more when their financial assets and home prices rise in value.
8 Bloomberg, January 9, 2026.
9 As seen in the Consumer Expenditures Survey by the Bureau of Labor Statistics. Data as of December 19, 2026.
10 As seen in the Consumer Expenditures Survey by the Bureau of Labor Statistics. Data as of December 19, 2025.
11 U.S. Energy Information Administration.
12 University of Michigan, February 2026.
13 Bureau of Labor Statistics Consumer Expenditure Survey. Data as of December 19, 2026.
Investing involves risk, including possible loss of principal. This material is neither an endorsement of any security, index, or sector, nor a solicitation to offer investment advice or sell products or services. The opinions expressed in this communication represent the current, good-faith views of Empower at the time of publication and are provided for limited purposes, are not intended as investment or legal advice, and should not be relied on as such.
This content is based on the information available at the time of the recording and may change based on more current conditions. Past performance, where discussed, is not a guarantee of future results. Investing involves risk. This is neither an endorsement of any index, sector, or investment, nor a solicitation to offer investment advice or sell products or services offered by Empower or its affiliates. It is impossible to invest directly in an index.
The information presented was developed internally and/or obtained from sources believed to be reliable; however, Empower does not guarantee the accuracy, adequacy, or completeness of such information. Predictions, opinions, and other information contained in this communication are subject to change and without notice of any kind and may no longer be true after the date indicated. Commentary may contain forward-looking statements based on reasonable expectations, estimates, projections, and assumptions.
Forward-looking statements are not guarantees of future performance and involve certain risks and uncertainties, which are difficult to predict. “Bloomberg® ” and the indices referenced herein (the “Indices,” and each such index – an “Index”) are trademarks or service marks of Bloomberg Finance L.P. and its affiliates, including Bloomberg Index Services Limited (“BISL”), the administrator of the Index (collectively, “Bloomberg”), and/or one or more third-party providers (each such provider, a “Third-Party Provider”) and have been licensed for use for certain purposes to EMPOWER RETIREMENT, LLC (the “Licensee”). To the extent a Third-Party Provider contributes intellectual property in connection with the Index, such third-party products, company names, and logos are trademarks or service marks, and remain the property, of such Third-Party Provider. Bloomberg is not affiliated with the Licensee or a Third-Party Provider, and Bloomberg does not approve, endorse, review, or recommend the financial products referenced herein (the “Financial Products”). Bloomberg does not guarantee the timeliness, accurateness, or completeness of any data or information relating to the Indices or the Financial Products.
This material is for informational purposes only and is not intended to provide investment, legal, or tax recommendations or advice.
“EMPOWER” and all associated logos and product names are trademarks of Empower Annuity Insurance Company of America.
©2026 Empower Annuity Insurance Company of America. All rights reserved. INV-FBK-WF-5933029-0326 RO5271154-0326