
Empowering America’s Financial Journey™ 2025
Government sector
Empowering America’s Financial Journey™ 2025
Government sector
Annual study of participant behaviors from Empower
The year 2024 demonstrated the value of public sector retirement plans as a foundation for America’s future financial security. Against a backdrop of market gyrations and economic uncertainty, savings rates across government plans held steady, at 6.4%. Active government plan participants enjoyed higher incomes and average account balances, partly the result of solid stock market performance.
This fourth study, Empowering America’s Financial Journey™ (EAFJ Government edition), is designed to use plan data to help employers really understand their employee demographics and behaviors |
It covers the retirement behaviors of more than 2.6 million active participants in state and local defined contribution (DC) plans for which Empower serves as recordkeeper.1 It offers data-intensive analysis and insight into how public sector workers are faring
along their retirement pathways, which we believe is the most productive way for plan sponsors to put participants first and improve outcomes.
Our analysis provides an aggregate view of public 457(b), 401(a), 401(k), and 403(b) plans administered by Empower as of December 31, 2024. The report draws on plan engagement, investment behavior, savings patterns, and demographic segmentation.

Top-line findings
1
Savings overall is holding steady
Despite inflationary pressures in 2024, government-plan participants enjoyed higher incomes and account balances, partly the result of solid market experience. Average savings rates held steady, and, consistent with previous years’ findings, were higher for lower-income workers.
2
Clear differences in generational behaviors
Comprising nearly three quarters (73.8%) of all government plan participants, mid-career and pre-retiree workers (that is, Gen X and millennials) are generally more engaged with their plans than younger, lower-income Gen Z workers. Average balances, incomes, and savings rates also increase with age and engagement. That said, engaged Gen Z participants save more than unengaged millennial and Gen X participants and nearly as much as boomers — highlighting the critical importance of engagement to pursuing financial success.
3
Engagement levels clearly improve outcomes
Participant engagement of government participants was up 6% in 2024 from the previous year. Engaged government participants have account balances that are 2.6x of unengaged participants — a relationship that holds true across all income levels and job tenures. We also find that participants who used the Empower Personal Dashboard™ and linked three or more external accounts save at 9.2%, on average — much more than participants who are engaged, unengaged, or receive advice. Using a personal dashboard allows participants to pull into a single holistic view their outside personal accounts such as savings, pension, brokerage, or credit cards — giving them greater control over their finances.
Engaged government participants save 79% more and have average account balances that are 160% higher than unengaged participants |
4
Workforce results diverge by salary, tenure, and engagement
Workers in public utilities and water authority segments have the highest average account balances, while state, K-12 and hospital/healthcare plan participants have lower average balances. Education workers have the highest average savings rates, while state workers have the lowest.
5
Professionally managed investment solutions add value
Nearly six in 10 participants use professionally managed investment solutions, including target date funds (TDFs) and managed accounts. Overall, participants in government plans using a managed account solution tend to save 28% more and have 56% higher average balances than TDF users. That said, the use of professionally managed solutions tends to decline with age.

Trends to watch
Generational differences color Americans’ views of financial success
Empower recently undertook a survey2 that identified American perceptions of barriers to financial success — a desired state that 72% of government employees believe they will achieve during their lifetimes. But less than half (41%) of government workers also feel they’ll never achieve the level of success they’re seeking.


The economy, 39%. Lack of savings, 36%. Excessive debt, 36%. Overspending/not budgeting, 30%. Income instability, 30%. Not setting clear financial goals, 28%. Procrastination, 23%.
Tellingly, younger generations of Americans across all industries are the most optimistic that they will achieve financial success in their lifetimes (71% of Gen Z and 70% of millennials), while Gen X (53%) and boomers (45%) are significantly less optimistic.
Nearly half (45%) of government workers say their generation needs financial help because they are at a disadvantage compared to other generations. Younger workers agree with this sentiment at a higher rate than older generations.3
In this year’s government sector EAFJ report, we intentionally dove into generational differences among public sector workers to better understand their goals and motivation driving engagement with their retirement plans |
As one might expect, we find that average account balances, income, and savings rates increase with age. But this alone doesn’t tell the complete story. In fact, although as a group they are less engaged with their retirement plans than Gen X or millennials, engaged Gen Z participants save more than unengaged millennial and Gen X participants and nearly as much as boomers — highlighting the critical importance of engagement to pursuing financial success.
Tool usage improves engagement
There’s a strong correlation between tool usage and higher savings rates across all generations. Usage of mobile apps increased 16% year-over-year (YoY), and engagement improved by 6%. We learned that participants earning less than $60K who used digital tools saved 33% more than the average savings rate.
Professionally managed investment solutions drive better outcomes
Although they are not necessarily suited to all plan participants, professionally managed investment solutions such as managed accounts can demonstrably help people regardless of age, income, or tenure. In a related companion study of corporate, government, and not-for-profit plans that use advisory services, managed account members showed 32% higher contributions and 27% higher account balances than those in other professionally managed solutions.4 In addition, when it comes to engagement such as website tool usage, app usage, and meeting with a representative, government participants in managed accounts are significantly more engaged (70.7%) than those in a target date fund (53.4%) or who take a do-it-yourself (DIY) strategy (54.3%).
Engagement is defined as at least one interaction in a 12-month period between January 1, 2024, and December 31, 2024, through participant website, mobile apps (Android™ or iOS®), Empower Customer Care Center, and the Empower Workplace Planning and Advice (WPA) serviced by Empower financial advisors. |

Q3 2020, 6.1%. Q1 2021, 6.3%. Q1 2022, 6.5%. Q1 2023, 6.4%. Q1 2024, 6.4%.
Against a backdrop of market gyrations and economic uncertainties, savings rates across government plans have been holding steady at 6.4% |
The stickiness of the savings rate over time lends strength to the argument that qualified plans are highly effective long-term savings vehicles, and employees are less likely to tap them for liquidity when economic conditions become challenging. Public sector employees remain less likely to access loans or hardship withdrawals than corporate plan participants.

Savings behavior and engagement remain critical to plan success
As noted earlier, the average savings rate for Empower’s government plans held steady at 6.4% in 2024 (no change over 2023), despite considerable economic uncertainty and market volatility in the United States and across the globe. Engagement across all plan types and industry sectors increased to 55.8% (up 6% from 2023), digital engagement grew by 6%, call and advice interactions went up by 10%, and use of apps went up by 16%.
A consistent finding over the four years we have conducted the analysis is that higher participant engagement directly correlates to greater satisfaction with their retirement plans and better retirement preparedness.

Total engagement, 2021, 46%. 2022, 48%. 2023, 53%. 2024, 56%. Digital engagement, 2021, 42%. 2022, 45%. 2023, 50%. 2024, 53%.
Savings behavior by generation
The data reveals notable generational differences in retirement savings behavior:
- Gen Z, with low average account balances ($7.5K), incomes ($57K), and savings rates (4.4%), are also the least engaged of all generations.
- Millennials, ranking third in average balances ($25K), are far more likely to use professionally managed accounts (71%) than other age groups, and lag behind Gen X and boomers in engagement.
- Gen X, which serves as a proxy for pre-retirees, tend to have higher average incomes ($86K) and digital engagement activity than most other age groups.
- Boomers and older cohorts have the highest average account balances ($98K), savings rates (8.8%), and interactions with the Empower Customer Care Center.

Gen Zers, The least engaged generation. Millennials, Most likely to use professionally managed services. Gen Xers, the most engaged generation.

Gen Zers, $7.5k. Millennials, $24.6k. Gen Xers, $69.6k. Baby boomers, $92.2k. Overall, $55.5k.

Gen Zers, 4.4%. Millennials, 5.3%. Gen Xers, 6.8%. Baby boomers, 8.8%. Overall, 6.4%.
Savings rates by generation: Engaged vs. unengaged
We see stark differences in how much each age cohort saves based on whether they are engaged or unengaged with their retirement plan.

Gen zers, 3.3%, 5.5%. Millennials, 3.7%, 6.2%. Gen Xers, 4.4%, 7.8%. Baby boomers, 5.6%, 10.3%.
Given their proximity to retirement age, Gen X participants are, not surprisingly, the most engaged at 59%, followed by millennials (56.5%), boomers (55.1%), and Gen Z (40.0%). Many studies show that younger generations often have difficulty visualizing their future financial selves and thus pay less attention to retirement planning.
However, since we see that when Gen Z participants are engaged, their savings rate surpasses that of unengaged millennials and Gen X participants, there is an opportunity to help get younger workers on a better path for success.

Gen Z, 40%. Millennial, 56.5%. Gen X, 59%. Baby boomer, 55.1%.
We also discovered an important correlation between savings rate and age, income, and engagement, especially among Gen Z participants |

Less than $60, 41%, 3.9%. $60-$90k, 65%, 5.3%. $90-$120k, 73%, 6.2%. $120k+, 56%, 5.6%.
There are exceptions to this general theme that relate to higher-income, younger employees. Within the Gen Z cohort, engagement is highest among participants with incomes between $90K and $120K, at 73%. This subgroup also has the highest average savings rate (6.2%) and account balances ($19K).

State, 17%, 45%, 27%, 10%. County, 16%, 46%, 30%, 8%. City, 15%, 42%, 31%, 13%. Transportation, 14%, 51%, 30%, 5%.
Stark differences in balances and savings rates by sector
Employee savings behaviors within and across public sector segments vary significantly due to salary, tenure, engagement, and other factors.
- The healthcare and public safety segments have some of the highest proportion of Gen Z savers, as new nurses and police officers continue to replace exiting workers in those segments.
- Workers employed by public utilities and water authorities have the highest average account balances ($122K and $117K, respectively) and exceed the average account balance for private sector workers ($109K).
- State, K-12, and hospital/healthcare segments all have average balances below $55K. K-12 savers have the highest savings rates (9.7%), while savers in state plans have the lowest rates (5.9%), showing that savings rate does not necessarily correlate with balance or income.


State, $46k, 5.9%. County, $86k, 6.9%. City, $58k, 7.2%. Transportation, $69k, 6.5%. Healthcare, $52k, 7.2%.
Experience before and after retirement
Plan sponsors are often curious about how their plan participants are positioned financially as they approach retirement age and after they leave the workplace. Of course, these cohorts cannot be easily compared, as their primary retirement objectives are diametrically opposed — accumulation versus decumulation.
Our study shows that retirees have higher average account balances and are less likely to use professionally managed investment services. Possibly reflecting their higher-earning years and an ever-shortening window to retirement, pre-retirees generally are more active and have relatively high digital engagement with their plans.

Professionally managed, 52%, 32%. Engaged, 59%, 52%. Web engaged, 47%, 35%. App engaged, 23%, 17%.
There are additional nuances between advice engagement with pre-retirees and retirees that emerge from a deeper dive into average balance and income data. Retirees with higher balances (>$20K) tend to engage more with an Empower representative than pre-retirees. However, pre-retirees with lower balances (<$20K) and incomes (<$60K) are more likely to engage with an Empower representative than retirees.

Less thank $60k, 7.5%, 7.2%. $60-$90k, 10.5%, 15%. $90-$120k, 12.5%, 18.5%. $120k+, 14.9%, 18%.

Less than $5k, 3.9%, 1.3%. $5k-$20k, 5.5%, 3.1%. $20k-$50k, 8.2%, 9.9%. $50k-$100k, 10.9%, 12.9%. $100k-$250k, 12.9%, 16.0%. $250k+, 16.4%, 23%.
Savings behavior by investment strategy, income, and tenure
We find that participants who use professionally managed advice and managed account solutions tend to be the most engaged across all generations of participants. Given that 62% of government workers say they need good financial advice now more than ever,5 it’s not surprising to see those with managed account solutions are more engaged than those in other investment strategies.


Gen Zers, DIY 29%, ADV/MA 67%, TDF+ 42%. Millennials, DIY+ 56%, ADV/MA, 71%, TDF+, 54%. Gen Xers, DIY+, 58%, ADV/MA, 71%, TDF+, 56%. Baby boomers, DIY, 52%, ADV, 71%, TDF, 55%.
Furthermore, it is not surprising that engaged participants save more across all income levels, as this cohort has set retirement security as an important personal goal.

Less than $60k, 3.8%, 7.2%. $60k-$90k, 4.1%, 7%. $90k-$120k, 4.8%, 8%. $120k+, 5.6%, 8.4%.
As noted above, savings rates generally increase at higher incomes, but lower-income participants (<$60K) tend to save 89% more when they are engaged. We believe that this group stands to benefit more from engagement than most income groups.
In addition, engaged participants are likely to save more across all tenure classifications.

Less than 1 year, 3.3%, 5.9%. 1-3 years, 3.8%, 6.5%. 3-8 years, 4.2%, 7.2%. 8-16 years, 4.6%, 8%. 16+ years, 5.2%, 8.6%.
As with income stratification, tenure appears to accrue the biggest benefit to recent hires who are engaged. While longer-tenured participants generally save at higher rates the longer they are with an organization, newer participants (</=1 year) tend to save 79% more when engaged.
Plan sponsors who are looking to boost participation rates may find the best opportunities come from engaging younger, newer employees early in the onboarding process |
Loans and hardship withdrawals
Consistent with previous-year results, loans are less prevalent in the public sector than in the private sector. Approximately 9.8% of all public sector participants had an outstanding loan at the end of 2024, compared to 16.7% of private sector participants.6
In addition, public sector savers taking out a new loan increased by 23% more than in 2024 and those taking a hardship withdrawal increased by 87% (from less than 1%). Notably, the number of participants with multiple active loans declined by 29%.

Public safety, 0.6%, 4.5%. Water, 0.7%, 5.2%. Others, 1.0%, 3.7%. Public utilities, 0.8%, 4.2%. K-12, 0.2%, 1.1%. Healthcare, 2.0%, 4.3%. Transportation, 2.5%, 12%. City, 0.5%, 4.8%. County, 1%, 7.4%. State, 0.7%, 2.7%.
Some of our key observations from the loans and hardship withdrawals activity include the following:
- The average new loan amount and average hardship amount increased to $11,096 and $7,638 (an uptick of 1% and 11%, respectively, over the prior year).
- Transportation-sector borrowers take new loans and hardship withdrawals at twice the rate of the government markets’ average. This segment also had the highest percentage of loans in the prior-year study. A variety of factors, including plan design, income, and financial stress, may contribute to this trend.
- K-12 participants have the highest savings rates, the lowest new-loan rates, and relatively low average loan balances.


Improving outcomes
Average account balances and incomes of government-sector participants increased by 7% and 6% in 2024, respectively. A significant part of the balance increase is likely due to the 25% return of the U.S. stock market in that year, as measured by the S&P 500® Index, general optimism about the economy, and a resilient consumer.
We are encouraged by data that show that government-sponsored DC plans are continuing to provide a strong financial foundation for America’s workers |
Investment strategies contribute to successful outcomes
Evidence is mounting that the provision of professional advice is greatly helping government participants pursue their retirement goals.


Managed account, $51.1k, 6.6%. Target date funds, $32.7k, 5.1%.
Professional advice services can help address participants’ unique financial situations and create tailored plans for meeting their short- and long-term goals. We found that managed account members saved 28% more and had 56% higher balances than TDF users. Engagement was 71% among managed account users vs. 54% among TDF users.

Public safety, 62%, 38%. City, 49%, 51%. K-12, 49%, 51%. County, 47%, 53%. Others, 44%, 56%. Water, 44%, 56%. Public utilities, 43%, 57%. Transportation, 38%, 62%. State, 36%, 64%. Healthcare, 34%, 66%.
There are two notable outliers
- Healthcare — Nearly two out of three healthcare workers use a professionally managed investment strategy — the highest percentage in our dataset. The hospital/healthcare segment also has a high proportion of active savers with less than three years of tenure (28%), and a high proportion of Gen Z and millennial active savers (41%). With lower tenure, younger healthcare employees are more likely to either be auto-enrolled into a TDF or select a TDF when they join the plan.
- Public safety — At the other end of the spectrum, 62% of public safety participants save using a DIY approach.

Tool and advice use reinforces engagement
We can demonstrate that the availability, access, and use of digital tools and advice can improve outcomes. We first measure the average savings rate by the complexity of participants’ engagement with various Empower advice channels (e.g., digital tools on the website, website visits, use of the mobile app, calls to the Customer Care Center, face-to-face meetings with an Empower representative within the previous 12-month period, or connecting accounts).

Not engaged, 4%. Engaged, 6.4%. Financial wellness or advice, 8.2%. Personal financial dashboard users, 9.2%.
Digital tool users clearly save at higher levels than unengaged participants
As we continue to see the consumerization at the enterprise level (with organizations heeding employees’ demands for a personalized, technology-enabled, consumer-grade experience at work), a mobile-first, more individualized user experience gives participants ready access to educational tools that help manage their finances.
We also see that that greater tool usage is not concentrated among higher-income participants; it’s spread across all income levels and increases at higher incomes and balances.

4.8/5* rating in app store.

Less than $60k, 55%, 24%. $60-$90k, 59%, 18%. $90k-$120k, 61%, 9%. $120k+, 62%, 8%. Unknown, 56%, 40%.
Notably, about 60% of government participants have balances of less than $20K. When they use any of the available tools, they save at an average of 5%, which is a 52% higher rate than those with balances under $20K who do not use any tools (3.3%).

Less than $5k, 51%, 35%. $5k-$20k, 54%, 24%. $20k-$50k, 58%, 16%. $50-100k, 61%, 10%. $100k-250k, 65%, 9%. $250k+, 71%, 5%
* Tool usage shown is for website users and excludes participants who used Empower tools on the mobile app.
Roth utilization on the rise
Starting in 2023, as a result of passage of the Setting Every Community Up for Retirement Enhancement (SECURE) Act 2.0, employers have the option to allow employees to choose Roth contributions instead of traditional pretax contributions. With Roth accounts, the money goes in after taxes have been taken out, and qualified withdrawals are taken tax-free. Utilization of the Roth plan-design feature is an excellent opportunity for sponsors looking to offer more flexibility and tax savings in their government plans, and we expect to see more defined contribution (DC) plans with the Roth option being implemented.
This year’s data showed a strong correlation between higher savings rates and those participants who use Roth plan features, engagement tools, and professionally managed solutions.

Engaged, 45%, 56%, 73%. Website tool usage, 52%, 58%, 65%. Professionally managed, 43%, 68%, 71%.
Notably, participants whose plans do not offer Roth features have a higher proportion (42%) of more than one active loan, and are the least engaged (45.4%, compared to 72.9% of participants who have access to and use Roth features in their plans).
Participants who use Roth features available in their plan tend to save more, a relationship that we found holds true across all generations |
We see this phenomenon most visibly in Gen Z, who save 75% more than peers not using Roth. We expect the relationship between Roth usage and savings rates to gain further traction as the SECURE 2.0 provision requiring catch-up contributions for participants over age 50 to be directed to Roth accounts takes effect beginning in 2025.

Gen Zers, 3.4%, 6.0%. Millennials, 4.6%, 6.5%. Gen Xers, 6.2%, 8.2%. Baby boomers+, 8.4%, 11.4%.
Retirement Plan Advisor (RPA) meetings spur action
One-on-one interactions with retirement specialists have a high probability of boosting successful outcomes. Participants who met with Empower representatives saved 45% more, had 125% higher balances, and took 30% fewer hardship withdrawals.

Average savings rate, 6.2%, 9%. Tools users given web access, 57%, 81%.

Key takeaways
Engagement consistently leads to better retirement outcomes
Early engagement during onboarding is especially effective at helping new hires save at significantly higher rates than unengaged participants, but engagement also strongly correlates to higher balances and savings rates across all generations. Engaged participants save 80% more and have 160% higher balances, on average, than unengaged participants. Plan sponsors may be able to improve engagement by providing their recordkeeper with employees’ email addresses, if appropriate, and implementing well-crafted, coordinated retirement education campaigns that emphasize the benefits of registering on the website, professional managed investment solutions, linking accounts, the mobile app, etc.
Professional advice (e.g., managed accounts, one-on-one meetings)
can be highly effective
Plans offering managed accounts saw 28% higher savings and 56% higher balances among participants. Participants who met with Empower representatives saved 45% more and took fewer hardship withdrawals. We also found the usage of professionally managed investment solutions is 25% higher when plans offer managed accounts — a symbiotic relationship. Plans offering Roth showed higher engagement and savings, especially among younger participants. Plan sponsors may want to consider offering employees a variety of ways to access education and advisory services that meet them on their own terms.
Tool usage boosts outcomes — particularly among lower-income
and newer employees
There’s a strong correlation between engagement (e.g., digital tools on the website, website visits, use of the app, calls to the Customer Care Center, calls with an Empower representative within the previous 12-month period, or connecting accounts) and higher savings rates across all generations. Notably, Empower Personal Financial DashboardTM use is not concentrated among higher-income participants; it’s spread across all income levels and increases at higher incomes and balances. To increase awareness and action, plan sponsors need to encourage participants to use available tools in regular communications, across multiple channels. This is especially important for younger employees who generally prefer digital engagement over face-to-face meetings.
Generation gaps persist in savings behavior
Boomers and older cohorts have the highest average account balances, savings rates, and interactions with the Customer Care Center. Gen X, which serves as a proxy for pre-retirees, tend to have higher average incomes and digital engagement activity than most other age groups. Millennials, ranking third in average balances, are far more likely to use professionally managed accounts than other age groups, but lag behind Gen X and boomers in engagement. With the lowest average account balances, incomes, and savings rates, Gen Z is also the least engaged of all generations. We believe engagement among all of these groups can be improved by personalizing communications, tools, and one-on-one meetings with representatives, boosting savings by speaking to the unique financial situations and differing needs of these audiences. Retirees can also greatly benefit from engagement as they navigate spend-down strategies in retirement.
Sector differences reveal opportunities for targeted plan design
Employee savings behaviors within and across public sector segments vary significantly due to salary, tenure, gender representation, engagement, and other factors. Plan sponsors should consider how simplifying plan designs and features, consolidating plans, and streamlining investment menus may improve participation and help employees retire on time.

Methodology
Empower as recordkeeper data methodology
The objective of this analysis was to understand how participants behave and what drives that behavior and, as a result, what insights and learnings can help American workers on their journey to a secure retirement. To accomplish this, we analyzed the data of 2.6 million active defined contribution participant accounts with balances greater than $0 from state and local governments. Participant accounts that belong to Empower’s recently completed acquisitions of MassMutual’s and Prudential’s retirement businesses were included, now that they have been on Empowerʼs recordkeeping platform for at least 12 months. The study included defined contribution plans, such as 457(b), 401(a), 401(k), and 403(b) plans, from government institutions. All data is as of December 31, 2024.
Study data includes 2.6 million active government plan participants |
Data definitions
All data is as of December 31, 2024, for 2.6 million active, live, qualified government defined contribution plan participants with an account balance >$0.
Account linking or consolidation is the linking of multiple financial accounts that allows for the consolidated and comprehensive view of a participant’s financial situation.
Active participants include participants with governmental DC accounts having >$0 balances with the current employer. This excludes accounts of terminated and deceased participants and beneficiaries.
Advice/guidance is defined as human advice provided through Empower advisor interactions, participants enrolled in managed accounts, and participants who use the Help Me Do It section of the website.
DIY (do-it-yourself) participants are not enrolled in a professionally managed solution like a managed account or TDF.
Eligibility is calculated based on the date at which participants become eligible to participate in the retirement plan.
Engagement is defined as at least one interaction in a 12-month period between January 1, 2024, and December 31, 2024, through participant website, mobile apps (Android™ or iOS®), Empower Customer Care Center, and the Empower Retirement Solutions Group and retirement plan advisors serviced by registered investment adviser representatives. This excludes IVR interactions, email, mail, on-site group sessions, individual sessions, and webinars. Engagement is calculated for all active participants.
Gender break may not add up to 100% due to unavailability of gender information for some participants.
Generational age breakouts
• Silent generation: born in or before 1945
• Baby boomers: born between 1946 and 1964
• Gen X: born between 1965 and 1982
• Millennials: born between 1983 and 1995
• Gen Z: born in 1996 or later
Government defined contribution plans of state and local governments primarily include 457(b), 401(a), 401(k), and 403(b) plans.
Income represents compensation estimated for the full year. In cases where compensation information is missing or values are outside expected boundaries, reasonable estimates are used.
Savings rate is the portion of compensation a participant has chosen to contribute to the retirement account expressed as a percentage of compensation. It is calculated for eligible participants who are saving in their DC accounts and have a balance >$0. It does not include an employer match. For some plans in which the employer does not provide compensation information, savings rates are estimated using reasonable assumptions.
Silent generation data is not shown separately but are included in the total.
TDF (target date fund) users are only those participants who have 95% of their investment allocation invested in one or two target date funds.
TDF usage is provided when offered by a plan, unless otherwise noted.
Tenure is calculated based on the employment date.
Tool usage is for website only. Tool usage is calculated as a percentage of participants who used digital tools while visiting the Empower website. This excludes participants who utilized tools on the mobile app.
Values for each quarter are standalone, representing active participants with a balance greater than zero in that quarter.
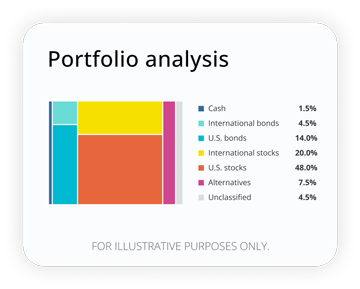
How well are your investments performing?
Analyze your portfolio in minutes and receive a target allocation for your goals.
1 This number increased 38% over 2023 as a result of Empower’s acquisition and integration of Prudential’s full-service retirement plan recordkeeping and administration business in 2022. As a result of this transaction, more than 4,300 government and corporate workplace savings plans, through which approximately 4 million plan participants save for retirement, were added to the Empower platform.
2 The Empower “Secret to Success” study is an online survey with responses from 2,203 Americans ages 18+ fielded by Morning Consult on September 12-14, 2024. The survey is weighted to be nationally representative of U.S. adults (age 18+). Government employee sample size is 99.
3 Empower’s “The Network Effect” study, 2024. Government employee sample size is 133 workers.
4 Empower Advisory Group, LLC. recordkeeping data as of December 31, 2024, across corporate, government, and not-for-profit plans that use Advisory Services including My Total RetirementTM, Professional Management Program, and Advisor Managed Accounts or target date funds (those who have 95% of more assets in up to two TDFs), asset allocation funds, or risk adjusted models over a five-year period. The income in retirement statistic is based on data as of December 31, 2024, for participants across corporate, government, and not-for-profit plans who own target date funds (those who have 95% or more assets in up to two TDFs), asset allocation funds, or risk adjusted models over a five-year period. The analysis uses the following methodology. It compares managed account participants to participants in three other QDIA solutions (Target Date Funds, asset allocation funds, risk-adjusted model portfolios) over a five-year period ending December 31, 2024 in the same plan. The collective number of participants was 387,000 across these solutions. Participants must have been in their respective solutions for at least five years with active balances. This includes individuals across government, corporate, and not-for-profit plans including all plan types (401(k), 457, 401(a), 403(b), 457(b), etc.). It includes participants with salaries between $20,000 and $300,000 grouped into four salary groups. It includes participants whose ages range between 25 years old up to 67 years old, grouped into four age groups and individuals with plan eligibility between five years and 20 years, grouped into two tenure groups. A minimum of three participants in each product is required for the cohort to be included in the analysis. Current Lifetime Income ScoreSM minus Social Security and minus outside assets creates the differential in Lifetime Income Scores for managed account participants compared to participants in three other QDIA solutions (target date funds, asset allocation funds, risk-adjusted model portfolios).
5 Empower, “The Great Decide,” 2025. Study is based on online survey responses from 2,208 Americans ages 18+ fielded by a third-party panel provider from March 20-21, 2025. The survey is weighted to be nationally representative of U.S. adults (aged 18+).
6 Part of this increase is attributable to the relatively high number of outstanding loans that carried over from the Prudential transaction — these participants have 74% more outstanding loans than the prior year’s participants in our study.
7 “What if You Could Exit the 401(k) Business?” PLANSPONSOR, October 15, 2019.
IMPORTANT: The projections or other information generated on the website by the investment analysis tool regarding the likelihood of various investment outcomes are hypothetical in nature, do not reflect actual investment results, and are not guarantees of future results. The results may vary with each use and overtime.
Online Advice and the Managed Account service are part of the Empower Advisory Services suite of services offered by Empower Advisory Group, LLC, a registered investment adviser. Past performance is not indicative of future returns. You may lose money.
Risks associated with investment options can vary significantly, and the relative risks of investment categories may change under certain economic conditions.
The research, views, and opinions contained in these materials are intended to be educational; may not be suitable for all investors; and are not tax, legal, accounting, or investment advice.
Empower and its affiliates are not providing impartial investment advice in a fiduciary capacity to the plan with respect to this material. The plan fiduciaries are solely responsible for the selection and monitoring of the planʼs investment options and for determining the reasonableness of all plan fees and expenses.
Empower refers to the products and services offered by Empower Annuity Insurance Company of America and its subsidiaries. This material is for informational purposes only and is not intended to provide investment, legal, or tax recommendations or advice.
“EMPOWER” and all associated logos and product names are trademarks of Empower Annuity Insurance Company of America.
©2025 Empower Annuity Insurance Company of America. All rights reserved. WSA-FBK-WF-4395593-0625 RO4515781-0625
 Be current.
Get insights and intel on your money.
*If you’re already registered with Empower, please use the same email address as your existing account.
The content contained in this blog post is intended for general informational purposes only and is not meant to constitute legal, tax, accounting or investment advice. You should consult a qualified legal or tax professional regarding your specific situation. No part of this blog, nor the links contained therein is a solicitation or offer to sell securities. Compensation for freelance contributions not to exceed $1,250. Third-party data is obtained from sources believed to be reliable; however, Empower cannot guarantee the accuracy, timeliness, completeness or fitness of this data for any particular purpose. Third-party links are provided solely as a convenience and do not imply an affiliation, endorsement or approval by Empower of the contents on such third-party websites. This article is based on current events, research, and developments at the time of publication, which may change over time.
Certain sections of this blog may contain forward-looking statements that are based on our reasonable expectations, estimates, projections and assumptions. Past performance is not a guarantee of future return, nor is it indicative of future performance. Investing involves risk. The value of your investment will fluctuate and you may lose money.
Certified Financial Planner Board of Standards Inc. (CFP Board) owns the certification marks CFP®, CERTIFIED FINANCIAL PLANNER™, CFP® (with plaque design), and CFP® (with flame design) in the U.S., which it authorizes use of by individuals who successfully complete CFP Board's initial and ongoing certification requirements.