
Empowering Americas Financial Journey 2025
Beyond the basics: What sets top retirement plans apart
New findings from Empowering America's Financial Journey 2025 show how plan design, simplicity and participant support shape financial readiness
Beyond the basics: What sets top retirement plans apart
New findings from Empowering America's Financial Journey 2025 show how plan design, simplicity and participant support shape financial readiness

06.10.2025
At a glance:
- Employees who engage with their retirement plan are more likely to fully utilize an employer match
- Plans with immediate vesting see stronger participation
- Clear, simple matching formulas outperform more complex ones
- Auto-enrollment boosts participation — but doesn’t guarantee savings
- Professional advice helps lead to smarter investing
Retirement plans aren’t one-size-fits-all
Retirement plans across the U.S. reflect the diversity of the workplaces that offer them. Empower’s 2025 Empowering America’s Financial Journey 4th Edition report — based on data from 6.5 million defined contribution active plan participants with data from December 31, 2024 — explores how plan design influences savings, engagement, and long-term financial outcomes across sectors and organization sizes.1
The study moves beyond traditional one-size-fits-all approaches, analyzing how employee behavior, from enrollment and contribution rates to investment decisions, is shaped by factors such as industry norms, workforce structure, and access to tools and advice. By identifying these patterns, plan sponsors can better align features with employee needs.
Key areas of focus include engagement, savings, participation, and investing. The data shows that engaged participants are nearly 2.5 times more likely to fully utilize their employer match and twice as likely to contribute above the threshold. Immediate vesting policies are associated with higher participation, and simple match formulas outperform more complex designs. Auto-enrollment drives participation, but it takes ongoing engagement to move contribution rates higher.
Engagement: A key factor in saving more
Across income levels and industries, employees who interact with their retirement plans save more. Participants who access their accounts through digital platforms or speak with financial advisors contribute nearly 70% more than those who do not.
Among the most engaged participants, average savings rates reached 8.6% — compared to just 5.5% for unengaged participants. While higher incomes saw different savings rates, for instance, with engaged participants with incomes of $250K+ saving an average of 10.6%, compared to 8.3% for non-engaged, even those with incomes under $40K who engaged still saved an average of 8%, compared to 4.7% among their disengaged peers.
Gen X leads in overall engagement (72%), while digital-native Millennials make the most use of mobile apps. Boomers prefer phone calls, but log in more frequently for digital sessions once online.

Source: Empowering America's Financial Journey 2025
Participants using budgeting tools and personalized dashboards posted the highest average saving rates, reaching 11% or more in some income bands. Users of financial wellness tools saw average savings of 9.3% — well above the 5.4% average for unengaged participants.
Simple plan design drives better behavior
Simplicity matters. Plans that offer a clear, easy-to-understand matching formula see stronger contribution rates. The most common and most effective? A straightforward dollar-for-dollar match. Participants in these plans tend to save more than those in plans with complex or multi-tiered formulas.
While over half of all plans offer a 5% match cap, those with higher caps of 8% or more showed the most robust saving behavior.2 Participants saving at a 5% to 5.9% match cap saved 9.1% overall, while those at a 6% to 6.9% match cap saved an average of 10.1%, and those at a 10-15% match cap saved an average of 14.8%.

Source: Empowering America's Financial Journey 2025
Auto-enrollment helps, but needs a companion strategy
Automatic enrollment is a proven way to increase participation, especially in larger plans. Plans with auto-enrollment have a participant weighted average participation rate of 86%, compared with just 37% for those without.
Higher default enrollment rates do not appear to deter participation. Plans with auto-enrollment set at 6% or more showed no drop-off in engagement or opt-out rates. Participation held steady around 89% even at higher default contribution levels.
Among smaller plans under $5M, just 15% offer auto-enrollment, and only 58% of participants engage, compared to 79% of those in plans over $500M.
Shorter vesting schedules linked to higher participation
Plans that offer immediate vesting tend to have higher participation, regardless of plan size. This trend holds true whether or not auto-enrollment is used. The participant weighted average was 72% among plans with one to less than three years of vesting, compared to just 59% in plans with more than five years of vesting.
Among smaller plans with under $5M in assets, fewer than 20% offer immediate vesting, compared with more than 90% of large plans with over $200M in assets.
Professional guidance and managed accounts help boost outcomes
Access to financial advice correlates with stronger results. Participants enrolled in managed accounts showed 38% higher engagement, 27% higher average balances, and 17% stronger projected retirement income.3,4
Currently, 14% of eligible participants are enrolled in managed accounts. Gen X and Baby Boomers are the most likely users, particularly those earning between $60K and $150K.
In addition, those with managed accounts are twice as likely to take advantage of Roth IRAs or Roth 401(k) accounts than target date fund (TDF) users and are slightly more likely than self-directed participants to invest in Roth accounts.
In sectors such as mining, utilities, and tech, managed account enrollment was notably high, reflecting possible alignment with workforce needs and plan sponsor strategy.
HSAs show strong association with saving and engagement
Health savings accounts (HSAs) aren’t just about covering medical costs. HSA users tend to save more, engage more frequently with their accounts, and report higher retirement balances.
The average defined contribution balance and income across HSA status is $136.6K for HSA non-users compared to $177.4K for those who use HSAs. Among HSA users, one in five has more than $250K in plan assets.

Source: Empowering America's Financial Journey 2025
Participation varies widely by plan size and industry
Plan size plays a significant role in participant outcomes. Larger plans generally see higher engagement and participation, likely due to greater resources for education, outreach, and plan features like auto-enrollment. By sector, finance and utilities posted the highest engagement and participation rates. Industries with shift-based or seasonal work — including hospitality and agriculture — reported the lowest.
A more complete picture
The report offers a detailed look at how plan design, engagement strategies, and participant behavior intersect. While there is no universal formula, certain patterns stand out. Straightforward matching formulas, shorter vesting schedules, auto-enrollment paired with engagement, and access to advice all contribute to improved participant outcomes.
As workplace demographics evolve and financial priorities shift, plans that focus on clarity, accessibility, and meaningful engagement are more likely to see results.
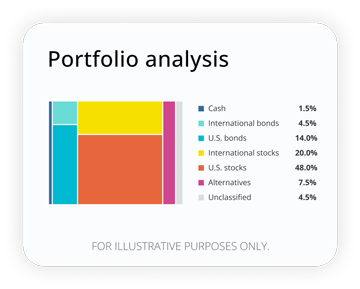
How well are your investments performing?
Analyze your portfolio in minutes and receive a target allocation for your goals.
1 Empower, “Empowering America’s Financial Journey,” June 2025
2 Participants over the compensation limit are restricted on the percentage of compensation they can contribute. For 2024, deferrals are capped at $23,500, excluding age-based catch-up contributions, and compensation is limited to $350,000, resulting in a maximum contribution rate of 6.71% ($23,500/$350,000). Providing a match on deferrals that exceeds that limit can create a situation in which highly compensated employees (HCEs) are limited on the match they can receive. Auto-escalation may offer a better solution than a stretch match, depending on the demographics of a plan. (Auto-escalation is not available in all states.)
3 Empower Advisory Group, LLC data across corporate, government, and not-for-profit plans. Engagement defined as at least three interactions on the participant website, mobile apps (Android™ or iOS®), or call center in a 12-month period between January 1, 2024, and December 31, 2024.
4 Empower data as of December 31, 2024, across corporate, government, and not-for-profit defined contribution plans. The analysis, done net of fees, compared managed account participants with those that invested in target date funds (95% or more assets in up to two TDFs), asset allocation funds, or risk-adjusted model portfolios in the same plan over a 5-year period ending December 31, 2024. The analysis considered approximately 387,000 total participants across these solutions. Participants must have had a balance in their respective solution in the same plan for at least 5 years. The analysis includes individuals across government, corporate, and not-for-profit plans including all plan types (401k, 457, 401a, 403b, 457b, etc). It includes participants with salaries between $20,000 and $300,000, ages between 25 years old and 67 years old, and plan eligibility between 5 years and 20 years. The median Lifetime Income Scores calculation used excludes income from Social Security and/or outside assets. The Lifetime Income Score is a retirement income projection and is hypothetical in nature. It does not reflect actual investment results and is not a guarantee of future results. The analyses present the likelihood of various investment outcomes if certain investment strategies or styles are undertaken, thereby serving as an additional resource to participants in the evaluation of the potential risks and returns of investment choices. Each simulation takes into account the participant’s current plan balance and investment mix as well as his or her age, income, retirement date, contribution rate, and likely future savings. It does not include outside assets and/or Social Security. The tool runs over 50 billion market simulations to provide an estimate of a monthly income likely to be generated at retirement and does not include fees.
RO4560510-0625


The Currency editors
Staff contributors
The CurrencyTM writers and editors cover the latest financial news and insights shaping how we live, work, and play. The team provides accurate, data-driven, and timely content aimed at empowering financial freedom for all.
The content contained in this blog post is intended for general informational purposes only and is not meant to constitute legal, tax, accounting or investment advice. You should consult a qualified legal or tax professional regarding your specific situation. No part of this blog, nor the links contained therein is a solicitation or offer to sell securities. Compensation for freelance contributions not to exceed $1,250. Third-party data is obtained from sources believed to be reliable; however, Empower cannot guarantee the accuracy, timeliness, completeness or fitness of this data for any particular purpose. Third-party links are provided solely as a convenience and do not imply an affiliation, endorsement or approval by Empower of the contents on such third-party websites. This article is based on current events, research, and developments at the time of publication, which may change over time.
Certain sections of this blog may contain forward-looking statements that are based on our reasonable expectations, estimates, projections and assumptions. Past performance is not a guarantee of future return, nor is it indicative of future performance. Investing involves risk. The value of your investment will fluctuate and you may lose money.
Certified Financial Planner Board of Standards Inc. (CFP Board) owns the certification marks CFP®, CERTIFIED FINANCIAL PLANNER™, CFP® (with plaque design), and CFP® (with flame design) in the U.S., which it authorizes use of by individuals who successfully complete CFP Board's initial and ongoing certification requirements.