
Pay at the pump: Gas prices by state
Pay at the pump: Gas prices by state
Gas prices increased 21.2% nationally in March 2026 amid geopolitical tensions, but some states have more pumped-up prices than others
Pay at the pump: Gas prices by state
Gas prices increased 21.2% nationally in March 2026 amid geopolitical tensions, but some states have more pumped-up prices than others
04.20.2026
Key takeaways
- Gas prices are averaging $4.04 per gallon nationally as of April 20.
- Californians are paying the most per gallon at $5.84, while Oklahoma residents currently enjoy the cheapest gas prices in the country at $3.38.
- Current gas prices are the highest seen since August 2022, as ongoing conflict in the Middle East continues to impact oil prices.
What’s the cost of getting from A to B? It turns out that the price of filling the tank depends on location, with some states offering more budget-friendly prices than others.
Gas prices were up 21.2% in March, the largest monthly increase since the Consumer Prices Index (CPI) was first published in 1967.1 The surge comes amid recent tensions in the Middle East, with crude oil prices having risen nearly 50% since the start of the conflict.1
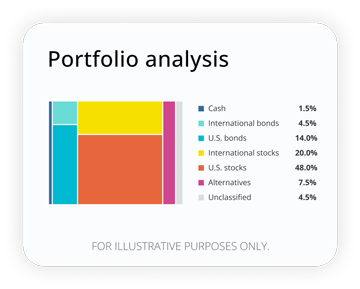
How well are your investments performing?
Analyze your portfolio in minutes and receive a target allocation for your goals.
Paying up
Currently, AAA reports the national average price for a gallon of regular gasoline stands at $4.04.2 Regular gas prices topped $4 a gallon at the end of March for the first time since August 2022.3
State-wide prices, however, tell a different story. Gas prices vary regionally due to factors such as taxes, transportation costs, supply chains, and local regulations. States with higher fuel taxes or limited access to refineries typically have higher prices, while those with lower taxes or abundant local supply often enjoy cheaper rates.4
Average gas prices by state
Which states are paying more at the pump? Data reveals Americans in California are paying the most for gas at $5.84 a gallon on average for regular fuel. They are closely followed by residents in Hawaii ($5.67), Washington ($5.39), Oregon ($4.99), and Nevada ($4.94). At the other end of the spectrum, the least expensive gasoline markets are Oklahoma ($3.38), Kansas ($3.47), Iowa ($3.55), Nebraska ($3.55), and Arkansas ($3.59).5
State | Regular | Premium | Diesel |
Alaska | $4.66 | $5.13 | $5.94 |
Alabama | $3.76 | $4.60 | $5.30 |
Arkansas | $3.59 | $4.37 | $5.08 |
Arizona | $4.59 | $5.29 | $5.92 |
California | $5.84 | $6.26 | $7.53 |
Colorado | $3.88 | $4.61 | $5.04 |
Connecticut | $4.05 | $5.01 | $5.84 |
District of Columbia | $4.28 | $5.21 | $5.85 |
Delaware | $3.91 | $4.82 | $5.72 |
Florida | $3.99 | $4.78 | $5.49 |
Georgia | $3.60 | $4.47 | $5.12 |
Hawaii | $5.67 | $6.16 | $7.08 |
Iowa | $3.55 | $4.39 | $4.99 |
Idaho | $4.31 | $4.88 | $5.46 |
Illinois | $4.30 | $5.35 | $5.37 |
Indiana | $3.76 | $4.80 | $5.37 |
Kansas | $3.47 | $4.13 | $4.71 |
Kentucky | $3.89 | $4.86 | $5.21 |
Louisiana | $3.68 | $4.51 | $5.14 |
Massachusetts | $3.95 | $4.93 | $5.84 |
Maryland | $4.04 | $4.95 | $5.78 |
Maine | $3.98 | $5.02 | $5.82 |
Michigan | $3.82 | $4.98 | $5.19 |
Minnesota | $3.66 | $4.60 | $5.05 |
Missouri | $3.62 | $4.35 | $4.84 |
Mississippi | $3.69 | $4.51 | $5.11 |
Montana | $3.88 | $4.52 | $4.97 |
North Carolina | $3.78 | $4.62 | $5.64 |
North Dakota | $3.59 | $4.33 | $4.85 |
Nebraska | $3.55 | $4.25 | $4.84 |
New Hampshire | $3.93 | $4.93 | $5.78 |
New Jersey | $3.95 | $4.76 | $5.75 |
New Mexico | $3.83 | $4.55 | $5.30 |
Nevada | $4.94 | $5.54 | $6.20 |
New York | $4.11 | $4.99 | $5.92 |
Ohio | $3.68 | $4.73 | $5.34 |
Oklahoma | $3.38 | $4.08 | $4.68 |
Oregon | $4.99 | $5.50 | $6.25 |
Pennsylvania | $4.09 | $4.91 | $6.01 |
Rhode Island | $3.94 | $5.02 | $5.74 |
South Carolina | $3.69 | $4.53 | $5.48 |
South Dakota | $3.66 | $4.35 | $4.78 |
Tennessee | $3.77 | $4.61 | $5.32 |
Texas | $3.66 | $4.49 | $5.13 |
Utah | $4.15 | $4.68 | $5.31 |
Virginia | $3.90 | $4.75 | $5.68 |
Vermont | $4.05 | $5.02 | $5.73 |
Washington | $5.39 | $5.87 | $6.87 |
Prices as of April 20, 2026.
States with the highest and lowest spending
How does the cost of gas compare to what people are actually spending? Empower Personal Dashboard TM data* reveals how much Americans are spending at the pump each month.
As of March 2026, drivers nationwide spend $198.50 a month on average, at $45.70 per transaction. At the state level, these are the 10 states with the highest and lowest expenditures during each visit to a gas station per the most recent Empower data:
Highest spending states
State | Average spend per transaction |
Alaska | $68.00 |
New Hampshire | $61.60 |
Maine | $61.30 |
Massachusetts | $59.20 |
Connecticut | $58.40 |
Lowest spending states
State | Average spend per transaction |
Iowa | $30.20 |
North Dakota | $32.00 |
Wisconsin | $33.40 |
South Dakota | $34.10 |
Mississippi | $35.50 |
Average spending per transaction in March 2026.
Frequently asked questions about gas prices by state
Why are gas prices higher in some states?
State-level taxes, environmental regulations, and refining costs drive regional price differences, with California among the highest.6
Which state usually has the cheapest gas?
Gulf Coast states such as Texas, Louisiana, and Mississippi frequently record some of the lowest average gas prices.7
How often do gas prices change?
Prices typically adjust daily, influenced by global oil markets, refining capacity, and local supply and demand.8
Who tracks U.S. gas prices?
AAA and the U.S. Energy Information Administration regularly publish national and state-level gasoline price updates.9,10
What causes sudden gas price spikes?
Geopolitical events, hurricanes affecting Gulf refineries, or sudden demand shifts can trigger short-term price surges.11
*Anonymized user data from the Empower Personal Dashboard™ as of March 2026.
1 Bureau of Labor Statistics, “Consumer Price Index – March 2026,” April 2026.
2 The New York Times, “A Record Jump in U.S. Gasoline Prices Is Squeezing Consumers,” April 2026.
3 AAA, “State gas price averages,” March 2026.
4 CNBC, “Gas in U.S. hits $4 a gallon for first time since August 2022,” March 2026.
5 U.S. Energy Information Administration, “Gasoline explained: Regional gasoline price differences,” September 2024.
6 AAA, “State gas price averages,” March 2026.
7 U.S. Energy Information Administration, “Gasoline explained: Regional gasoline price differences,” September 2024.
8 AAA, “State gas price averages,” March 2026.
9 Ibid.
10 Ibid.
11 U.S. Energy Information Administration, “Gasoline and Diesel Fuel Update,” March 2026.
12 U.S. Energy Information Administration, “Gasoline explained: Regional gasoline price differences,” September 2024.
RO5385423-0426


The Currency editors
Staff contributors
The CurrencyTM writers and editors cover the latest financial news and insights shaping how we live, work, and play. The team provides accurate, data-driven, and timely content aimed at empowering financial freedom for all.
The content contained in this blog post is intended for general informational purposes only and is not meant to constitute legal, tax, accounting or investment advice. You should consult a qualified legal or tax professional regarding your specific situation. No part of this blog, nor the links contained therein is a solicitation or offer to sell securities. Compensation for freelance contributions not to exceed $1,250. Third-party data is obtained from sources believed to be reliable; however, Empower cannot guarantee the accuracy, timeliness, completeness or fitness of this data for any particular purpose. Third-party links are provided solely as a convenience and do not imply an affiliation, endorsement or approval by Empower of the contents on such third-party websites. This article is based on current events, research, and developments at the time of publication, which may change over time.
Certain sections of this blog may contain forward-looking statements that are based on our reasonable expectations, estimates, projections and assumptions. Past performance is not a guarantee of future return, nor is it indicative of future performance. Investing involves risk. The value of your investment will fluctuate and you may lose money.
Certified Financial Planner Board of Standards Inc. (CFP Board) owns the certification marks CFP®, CERTIFIED FINANCIAL PLANNER™, CFP® (with plaque design), and CFP® (with flame design) in the U.S., which it authorizes use of by individuals who successfully complete CFP Board's initial and ongoing certification requirements.