
Capital markets perspective: Record territory
Capital markets perspective: Record territory
Capital markets perspective: Record territory

01.22.2024
On Friday the S&P 500 Index closed at 4,854 – its highest close ever. The NASDAQ 100, a slightly slimmer version of its more famous cousin, the NASDAQ Composite Index, achieved the same feat. While other areas of the market were not quite able to clear the “best-of-all-time” bar last week, most equity screens were green, and as I write this on Monday morning, the buying spree looks like it’s trying to maintain at least some of its momentum.
So how should we view last week’s record close for these two very prominent equity indices?
On one side of the argument, the soft-landing crowd was treated to yet another better-than-expected retail sales report last week: In December, Americans spent an estimated $710 billion dollars, an increase of 0.6% relative to November and 5.6% more than December 2022.1 Moreover, the gain came despite a big drop in gasoline and auto sales – two big categories than can push the total headline figure around a lot. And that upbeat result was accompanied by a much better-than-expected read on consumer sentiment from the University of Michigan,2 which reported the biggest two-month increase in consumer attitudes since the end of the 1990 recession – largely a result of a significant resetting of inflation expectations that became a significant cause for worry during the final few weeks of 2024.
There were also reasons to feel just a little bit better about two areas of the economy that have been famously under stress in recent months: housing and the goods-producing sector. Although current home sales remain remarkably depressed, the National Association of Homebuilders’ (NAHB) read of builder sentiment for January came in much better than expected, with expectations for sales over the next six months improving at the fastest rate since June of 2021.3 Meanwhile, industrial production – a figure that attempts to capture output at the nation’s manufacturers, mines and utilities – was more durable than expected and actually managed to increase slightly, defying economists’ expectations even as manufacturing itself seemed to slide deeper into contraction.
But for those inclined to look hard enough, it’s possible to find reasons to be skeptical of even those marginally positive datapoints. Take, for instance, news that existing home sales fell to a three-decade low in 2023 and continue to struggle with the headwinds of stubbornly high prices, tight resale inventories and still-challenging mortgage rates.4 While the NAHB’s nod to improving builder sentiment could eventually help relieve the housing inventory shortage, more relief on rates (and any relief at all on prices) are probably preconditions for continued improvement in the housing sector.
Over on the goods-producing side of the economy, the positive results for industrial production were perhaps overshadowed by last week’s regional Federal Reserve Board manufacturing reports: Conditions for Philadelphia-area manufacturers continued to deteriorate significantly,5 but not as badly as those in New York state, where the Empire State Manufacturing Index put in its worst performance since May 2020 – smack in the middle of the darkest months of the COVID pandemic. (Meanwhile, the Fed’s Beige Book was itself a study in beige, reporting that manufacturing had “slowed” in most regions of the country while economic growth showed little or no change.6 Both of those seem to understate the message being telegraphed by Empire State and the Philly Fed.)
And finally, the continued surge in retail spending is getting harder and harder to reconcile with the various headwinds building against consumers. But one way it might make more sense is when you consider a parallel increase in credit card balances, which breeched the $1 trillion mark for the first time in history in September.7 While credit card spending as a percent of personal consumption expenditures has not yet risen to levels reached in previous recessions, it’s not hard to imagine that changing quickly – particularly through compounding as card rates hover in excess of 20%. And it’s always wise to remember that a decline in nominal retail sales isn’t always required for a recession to be declared.
So the environment remains mixed, and earnings results so far have been inconclusive. One thing we can say, though, is that the fact that last week’s record close for stocks came during a week when 2- and 10-year treasury yields rose significantly feels at least somewhat at odds with common sense (as well as recent experience): If high interest rates are truly at the root of all this economic uncertainty, shouldn’t an 18-basis point week-over-week increase in 10-year yields and a 24-basis point increase in 2-year yields have left a dent in equity market performance? After all, that’s the direction in which the logic often runs – rates up/stocks down and vice versa. Besides, it didn’t feel like a coincidence at all when rates spiked and equity markets sold off during the first week of January.
Moreover, the increase in yields last week may have had something to do with comments from various Fed speakers, who tossed a little cold water on the optimism that has gripped market sentiment since Fed Chair Jerome Powell made his pivot toward looser policy back in mid-December. It pays to get at least a little suspicious when essentially the same thought comes from the mouths of different Fed speakers in such short order; it carries at least a whiff of coordination. That might suggest that the FOMC and its members have seen how markets rallied in response to Powell’s Pivot and are trying to prevent the market from loosening financial conditions too much all on their own.
Voting members of the Fed’s rate-setting committee might have observed the big gap between how fast the Fed thinks it will cut rates this year (i.e., 3-4 times) and what the markets think (6-7 times, beginning as soon as March) and are now trying to bring the two sides closer. If so, it sets up investors for a big disappointment later this year when all those hoped-for rate cuts are slow to materialize.
What to watch this week
This week’s earnings focus shifts from financials to the real economy, with consumer staples (GE, Johnson & Johnson, 3M and Philip Morris report on Tuesday), airlines (United on Monday, American and Southwest on Thursday) and rail carriers (Canadian National, CSX and Union Pacific) scattered throughout the week. We’ll also get results from a few fast-growers – Tesla on Wednesday and Netflix on Tuesday – as well as Intel (Thursday) and Visa (Thursday).
While it was difficult to find enough consistency in bank earnings to build a coherent narrative about the macro last week, it’s possible that this week could deliver some insight. In staples, I’d watch for signs of margin compression as a read into whether pricing power still exists at the point-of-sale, while airlines could provide a window into the future direction of services demand (which is still hanging in better than goods-producing sectors of the economy). Rails, which still serve as a significant as a mode of delivery for a large part of our national output, always provide context into aggregate demand more broadly.
Beyond that, it promises to be a relatively light week on the macro front. One interesting release may be Friday’s income and outlays report, which should once again serve as an important cross-check on last week’s unexpectedly strong retail sales report. Embedded in that report, watch for details on wage compensation and savings rates for additional color on the health of the U.S. consumer. Ditto for our first estimate of fourth-quarter gross domestic product (GDP), due on Thursday: The consumer is by far the biggest contributor to GDP growth, and GDP will likely remain positive until the consumer relents.
A close second will be Wednesday’s “flash” Purchasing Managers Indices release. This mid-month read of output and sentiment for both the manufacturing and services sector is likely to show continued (and perhaps deepening) contraction in manufacturing, while services continues to hover close to neutral. These reports are often considered among the most forward-looking of all macroeconomic data, but the PMIs have been saying generally the same thing for roughly a year. Any change in tone would likely catch the market off-guard.
Under the “odds-and-ends” category, we’ll get a few more housing-related datapoints (new and pending home sales, together with earnings from national builder DH Horton). Beyond that, Monday’s release of the Index of Leading Economic Indicators, or LEIs, from the Conference Board could be worth a look. The LEIs have been signaling recession for the better part of a year, but so far to no avail. Watch Monday’s release for signs that the mood has changed or that the economists at Conference Board have joined those banking on a soft landing.
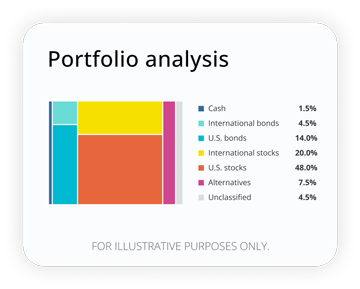
How well are your investments performing?
Analyze your portfolio in minutes and receive a target allocation for your goals.
[1] https://www.census.gov/retail/marts/www/marts_current.pdf
[3] http://www.sca.isr.umich.edu/
[4] https://www.nahb.org/news-and-economics/housing-economics/indices/housing-market-index
[5] https://www.nar.realtor/newsroom/existing-home-sales-slid-1-0-in-december
[6] https://www.philadelphiafed.org/surveys-and-data/regional-economic-analysis/mbos-2024-01
[7] https://www.federalreserve.gov/publications/files/BeigeBook_20240117.pdf
This material is neither an endorsement of any index or sector nor a solicitation to offer investment advice or sell products or services.
The S&P 500 Index and S&P MidCap 400 Index are registered trademarks of Standard & Poor’s Financial Services LLC. The S&P 500 Index is an unmanaged index considered indicative of the domestic large-cap equity market and is used as a proxy for the stock market in general. The S&P MidCap 400 Index is an unmanaged index considered indicative of the domestic mid-cap equity market.
Russell 2000® Index Measures the performance of the small-cap segment of the US equity universe. It is a subset of the Russell 3000 Index and it represents approximately 8% of the US market. It includes approximately 2,000 of the smallest securities based on a combination of their market cap and current index membership.
RO3342829-0124
 Be current.
Get insights and intel on your money.
*If you’re already registered with Empower, please use the same email address as your existing account.

Tom Nun, CFA
Contributor
Tom Nun, CFA, Portfolio Strategist at Empower, works alongside teams overseeing portfolio construction, advice solutions, portfolio management, and investment products and consulting.
The content contained in this blog post is intended for general informational purposes only and is not meant to constitute legal, tax, accounting or investment advice. You should consult a qualified legal or tax professional regarding your specific situation. No part of this blog, nor the links contained therein is a solicitation or offer to sell securities. Compensation for freelance contributions not to exceed $1,250. Third-party data is obtained from sources believed to be reliable; however, Empower cannot guarantee the accuracy, timeliness, completeness or fitness of this data for any particular purpose. Third-party links are provided solely as a convenience and do not imply an affiliation, endorsement or approval by Empower of the contents on such third-party websites. This article is based on current events, research, and developments at the time of publication, which may change over time.
Certain sections of this blog may contain forward-looking statements that are based on our reasonable expectations, estimates, projections and assumptions. Past performance is not a guarantee of future return, nor is it indicative of future performance. Investing involves risk. The value of your investment will fluctuate and you may lose money.
Certified Financial Planner Board of Standards Inc. (CFP Board) owns the certification marks CFP®, CERTIFIED FINANCIAL PLANNER™, CFP® (with plaque design), and CFP® (with flame design) in the U.S., which it authorizes use of by individuals who successfully complete CFP Board's initial and ongoing certification requirements.