
Capital markets perspective: Did Atlas just shrug?
Capital markets perspective: Did Atlas just shrug?
Capital markets perspective: Did Atlas just shrug?

02.20.2024
If the last 12-18 months have taught me anything, it’s to never underestimate the U.S. consumer. Despite numerous headwinds – waning stimulus savings, a re-start of student loan obligations, plateauing wage growth, a rising net interest burden – consumers have continued to spend.
Until, perhaps, last month. The U.S. Census Bureau released its advance estimate of retail sales for January: Sales at the headline level declined -0.8% month-over-month, the biggest drop since last March and well below economists’ expectations.1 What’s more, so-called “control group sales” (a sub-category that for some reason directly feeds the Bureau of Economic Analysis’ quarterly estimate of gross domestic product) fell -0.4%, also its biggest drop since last March. Suddenly the consumer, who has recently been holding up economic growth in much the same way mythical Atlas carried the world on his shoulders in ancient Greece, seems on the verge of shrugging off at least some of that burden.
Let’s be clear: One month of decline hardly defines a trend, and it’s perfectly possible that the U.S. consumer will simply re-shoulder the entire burden (and then some) in time to rescue first quarter GDP. It’s even possible that January’s decline could be revised away when the Census Bureau updates its estimate next month. But something feels more permanent about last week’s report than a pair of spending declines that occurred last February and March (which, after all, did not derail economic growth during the first quarter of 2023).
Maybe it’s because that episode at the beginning of 2023 came on the heels of a very robust January, which saw sales at the retail level grow more than 3%. That created a “tough comparison” for the month-over-month number, meaning that the next month or two were almost bound to decline without a truly stellar performance by the consumer. By contrast, last month’s bar was set pretty low: Retail spending has been kind of flattish since last fall. The fact that spending failed to meet even that easy test means that the consumer might finally be showing signs of fatigue.
Or maybe it’s because some of the spending categories that appeared to be under the most pressure inside last Wednesday’s report are also some of the more discretionary categories that tend to be most exposed to the business cycle, things like:
-
building materials (down -4.1% in January and -8.3% year-over-year)
-
furniture sales (up slightly last month but down -9.8% year-over-year)
-
electronics stores (-0.4% last month and -5.8% year-over-year)
-
autos (-1.7% last month and -1.6% year-over-year)
Perhaps ominously, these same categories were among those that came under the most pressure during the 2008-2009 recession – the last economic downturn that could credibly be called “consumer-led.”
But probably the second most important lesson I’ve learned since the COVID recovery began to mature (at least with regard to the consumer) is that trying to extrapolate consumer trends at the retail level into broader economic themes is also fraught with difficulty. That’s especially true in today’s environment, with inflation (past and present) still distorting consumer behavior in ways it hasn’t for the better part of a generation. There’s also the shift away from traditional modes of retail spending and a post-pandemic splurge to contend with, which for its part sent some of those same cyclically sensitive categories mentioned above dramatically higher when the economy re-opened for business. Declines in autos, electronics and furniture sales could therefore simply be the post-splurge pullback rather than an ominous sign that things are tipping over.
While others might see last week’s retail sales data as nothing more than a much needed but temporary breather for the U.S. consumer, I instead choose to imagine that Atlas’ biceps are beginning to quiver, at least a little bit.
Continuing on, last week’s retail sales data were interesting enough to bump what was arguably last week’s biggest news – inflation – to the second spot on the roster. Tuesday’s read on consumer prices nonetheless struck exactly the wrong tone, coming in higher than expected on both the headline and on the so-called “core” (which excludes food and energy).2 Notably, inflation was hottest in prices for services, not goods, continuing a trend in place for months and causing some commentators to fret about wage growth and inflation “stickiness.” Indeed, Tuesday’s consumer price index (CPI) release sent U.S. equity markets to one of their worst performances of 2024 so far and bumped U.S. Treasury yields notably higher, at least at the longer end of the curve.
Tuesday’s price action in both equities and treasuries would seem to agree with the notion that markets are once again paying attention to inflation and the Fed after long months of not adjusting much with data and news releases. But on the other hand, Tuesday’s selloff was well-contained, and when Friday’s producer price index (PPI) report came in even worse than Tuesday’s CPI,3 markets (equities, at least) hardly seemed to notice. To me, the most likely reason was two-fold: First, rising inflationary pressures at the producer level had been well-telegraphed in things like the PMIs and regional Federal Reserve manufacturing reports for several months running, meaning that those who watch this closely were probably less surprised by a worse-than-expected PPI than the hotter-than-expected CPI a few days earlier. Second, and maybe even more likely, it’s quite possible that the market simply got it off its chest on Tuesday and didn’t really see the point of a second big decline by the time Friday’s PPI came around.
Moreover, it’s worth remembering that inflation really only matters to markets in the near-term insofar as it influences the future direction of Fed policy. Interestingly, while Tuesday’s CPI data did cause a moderate reset in market expectations regarding the path of expected rate cuts this year (pushing the expected start of the easing campaign from May to June, for example), it didn’t really change where markets expect rates to be by the end of the year: The “sweet spot” for the number of quarter-point rate cuts in 2024 is still 4-5, pretty much where it was before last week’s CPI and PPI disappointments. Markets are also still pricing in more cuts than the Fed itself expects this year, setting markets up for potential disappointment unless something gives.
So the upshot is probably this: Last week’s hotter-than-expected inflation data succeeded in capturing the market’s attention for a short while but, at the end of the day, really did little to change the narrative in a big way and there was no real follow-through after Tuesday’s CPI-inspired declines. Make no mistake, that’ll change if the next few inflation prints also come in hot. But for now, I’d argue that the possible tipping over of consumer demand is the bigger story.
What to watch this week
We may not have to wait too long to see whether last week’s retail sales report was truly a turning point for the U.S. consumer or something far less dramatic and benign because Walmart is set to report earnings Tuesday. The company has a reputation for providing color and context during its earnings calls that befit a company with its immense gravity in the space: Walmart sold $442B worth of merchandise in the U.S. last year, roughly equivalent to six or seven months of throughput for all general merchandise stores in the U.S. at its current pace.
Also on the schedule for this week is NVIDIA Corp, which will report quarterly earnings on Wednesday. NVIDIA has become one of the most prominent standard-bearers for AI, making its results particularly noteworthy. It’s difficult to measure the extent to which AI excitement has pushed the current market’s durability in the face of a mixed economic outlook, but I believe it has been significant. If NVIDIA says or does something that runs counter to that optimism, investors will take note.
For trends in the real economy, look for Friday’s release from Warren Buffet’s Berkshire Hathaway – as good a cross-section of American business as you’re likely to find. To call Berkshire’s economic commentary colorful and contextual would be an understatement; the company’s earnings and quarterly commentary will be closely followed.
In terms of published economic data, a pair of similar-in-scope-and-purpose releases, the Conference Board’s Index of Leading Economic Indicators (LEI) and the Chicago Fed’s National Activity Index (CFNAI) are probably the most comprehensive reads into the economy on this week’s calendar. Both compile other published economic data into indices that attempt to forecast the direction of the economy as a whole. The LEI has been signaling recession for a year or more, while the CFNAI is only now starting to catch up. Watch both releases for a triangulated view on where we might go from here.
In a similar vein, Thursday’s flash PMIs from S&P® Global are worth a read. As has been true for a while, economists will scan the report for evidence that the manufacturing sector is continuing to contract while services continue to hold head above water. Perhaps of even greater interest, though, will be the interplay between prices paid and prices received by both types of businesses. As mentioned above, the PMIs joined the regional Fed manufacturing reports hinting that PPI inflation might be running hot. Further evidence of that could cause a re-think of inflation’s role in setting the narrative.
Finally, for those more interested in Fed policy for its own sake, Wednesday’s minutes of the Fed’s January 31 meeting could prove interesting. The main takeaway from that meeting was that the strength of the economy has presented the Fed with a unique opportunity to play wait-and-see: Because unemployment and aggregate demand have yet to tip over, the Fed can be patient while it waits for more evidence that inflation is truly on its way back to the Fed’s 2% target before beginning its easing campaign. While the post-decision press conference seemed to suggest that this feeling was unanimous among the participants, any hint to the contrary buried inside the minutes would be telling.
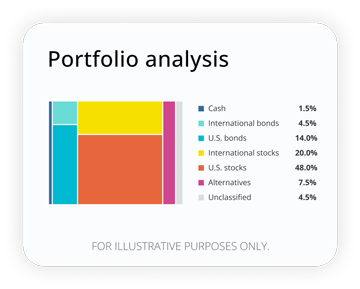
How well are your investments performing?
Analyze your portfolio in minutes and receive a target allocation for your goals.
1 https://www.census.gov/retail/marts/www/marts_current.pdf
2 https://www.bls.gov/news.release/cpi.t01.htm
3 https://www.bls.gov/news.release/ppi.t02.htm
This material is neither an endorsement of any security, index or sector nor a solicitation to offer investment advice or sell products or services.
The S&P 500 Index and S&P MidCap 400 Index are registered trademarks of Standard & Poor’s Financial Services LLC. The S&P 500 Index is an unmanaged index considered indicative of the domestic large-cap equity market and is used as a proxy for the stock market in general. The S&P MidCap 400 Index is an unmanaged index considered indicative of the domestic mid-cap equity market.
Russell 2000® Index Measures the performance of the small-cap segment of the US equity universe. It is a subset of the Russell 3000 Index and it represents approximately 8% of the US market. It includes approximately 2,000 of the smallest securities based on a combination of their market cap and current index membership.
RO3402532-0224


Tom Nun, CFA
Contributor
Tom Nun, CFA, Portfolio Strategist at Empower, works alongside teams overseeing portfolio construction, advice solutions, portfolio management, and investment products and consulting.
The content contained in this blog post is intended for general informational purposes only and is not meant to constitute legal, tax, accounting or investment advice. You should consult a qualified legal or tax professional regarding your specific situation. No part of this blog, nor the links contained therein is a solicitation or offer to sell securities. Compensation for freelance contributions not to exceed $1,250. Third-party data is obtained from sources believed to be reliable; however, Empower cannot guarantee the accuracy, timeliness, completeness or fitness of this data for any particular purpose. Third-party links are provided solely as a convenience and do not imply an affiliation, endorsement or approval by Empower of the contents on such third-party websites. This article is based on current events, research, and developments at the time of publication, which may change over time.
Certain sections of this blog may contain forward-looking statements that are based on our reasonable expectations, estimates, projections and assumptions. Past performance is not a guarantee of future return, nor is it indicative of future performance. Investing involves risk. The value of your investment will fluctuate and you may lose money.
Certified Financial Planner Board of Standards Inc. (CFP Board) owns the certification marks CFP®, CERTIFIED FINANCIAL PLANNER™, CFP® (with plaque design), and CFP® (with flame design) in the U.S., which it authorizes use of by individuals who successfully complete CFP Board's initial and ongoing certification requirements.